Airlines Lead Travel Advertising on TV, But Cruise Lines Are Growing Fast

Skift Take
If the first three weeks of 2016 are a barometer, then this is going to be a banner year for U.S. travel industry TV advertising, which jumped 54.1 percent to $88.8 million.
That’s according to an analysis provided to Skift by iSpot.tv, which tracked airline, cities and destinations, hotels and motels, resorts and theme parks, travel websites, and cruise lines’ advertising January 1 to 21, 2016 versus the same period last year. The whopping numbers don’t include car rental or sharing economy advertising.
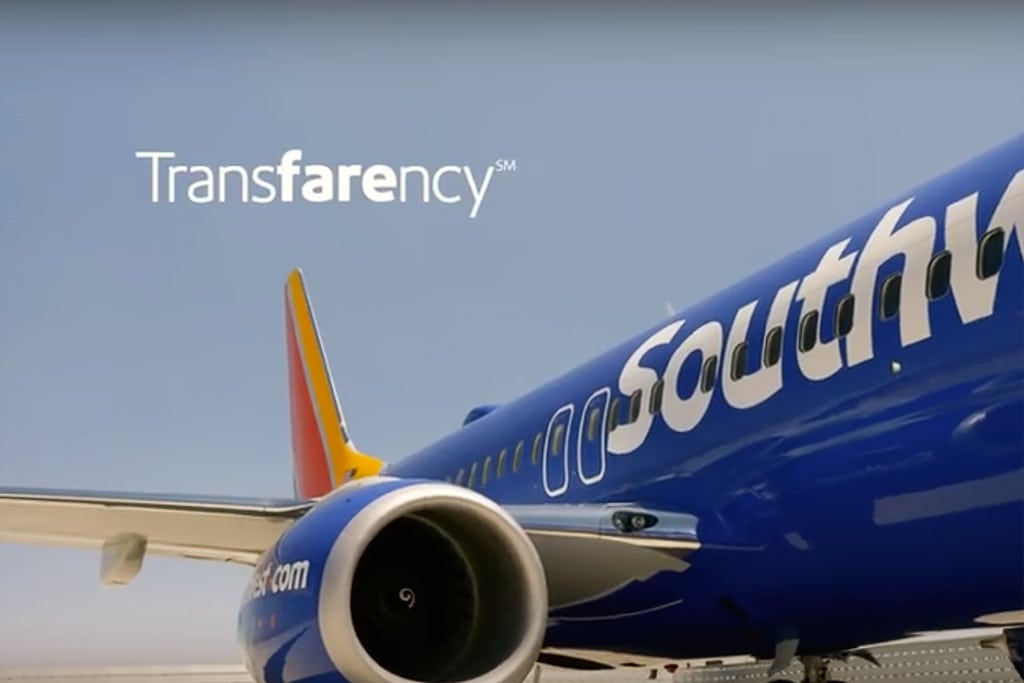
During the first three weeks of 2016, nine airlines spent $22.4 million in U.S. TV advertising, and that was a 69.7 percent increase over what just four airlines did from January 1 to 21, 2015, according to iSpot.tv’s tally. The top spending airline in 2016 so far has been Southwest, which is broadcasting its Nothing Up Our Sleeves spot [see below].
The fastest-growing sector in the travel industry in terms of U.S. TV advertising is cruise lines, which saw their spending in the first three weeks of 2016 jump 76.6 percent to $16.6 million. Royal Caribbean, with its This Is Not a Cruise: Come Seek ad [see below], was the top spender in the category, iSpot.tv states.
Another interesting takeaway is that travel websites such as Trivago, Expedia and Booking.com grew their spend 33.8 percent to $17.8 million. Trivago has been the category spend leader so far in 2016.
The growth in online travel agencies’ TV ad spending in the U.S. takes place despite the fact that TripAdvisor has decided to focus on its TripAdvisor Instant Booking implementation and to forego TV advertising in 2016.
But in the battle of booking channels, hotels versus online travel agencies, hotels were hardly part of the conversation with just $3.4 million of TV ad spending in the first three weeks of 2016, and that was a 25.9 percent leap.
Below is a chart depicting travel ad spending by sector, and beneath it is a breakdown of category leaders with their most noteworthy spots.
Travel Industry TV Ad Spending in U.S. For First 3 Weeks of 2016
| 1/1-1/21 2015 | 1/1-1/21 | 2016 | |||||||
|---|---|---|---|---|---|---|---|---|---|
| Sector | Spend | Brands | Spots | Airings | Spend | % Increase | Brands | Spots | Airings |
| Airlines | $13.2M | 4 | 7 | 208 | $22.4M | 69.70% | 9 | 17 | 415 |
| Cities & Destinations | $6.4M | 49 | 91 | 2266 | $9.2M | 43.70% | 51 | 113 | 3090 |
| Hotels | $2.7M | 18 | 26 | 713 | $3.4M | 25.90% | 12 | 16 | 1077 |
| Resorts & Theme Parks | $12.6M | 10 | 34 | 6220 | $19.4M | 53.90% | 18 | 56 | 8173 |
| Travel Websites | $13.3M | 12 | 25 | 5623 | $17.8M | 33.80% | 9 | 28 | 7697 |
| Cruise Lines | $9.4M | 7 | 14 | 4203 | $16.6M | 76.60% | 14 | 25 | 6330 |
Source: iSpot.tv
Airlines
Top Spender: Southwest Airlines
Ad with Highest Spend: ‘Nothing Up Our Sleeves’
Cities & Destinations
Top Spender: Utah Sports Commission
Ad with Highest Spend: ‘The State of Sport’
Hotels and Motels
Top Spender: Hilton Hotels Worldwide
Ad with Highest Spend: ‘Play Hooky’
Resorts and Theme Parks
Top Spender: Disney Parks & Resorts
Ad with Highest Spend: ‘Star Wars Awakens’
Travel Websites
Top Spender: Trivago
Ad with Highest Spend: ‘Jim the Hotel Owner’
Cruise Lines
Top Spender: Royal Caribbean Cruise Lines
Ad with Highest Spend: ‘This is Not a Cruise: Come Seek’


