New York City Subway Ridership Reaches Highest Level Since 1949
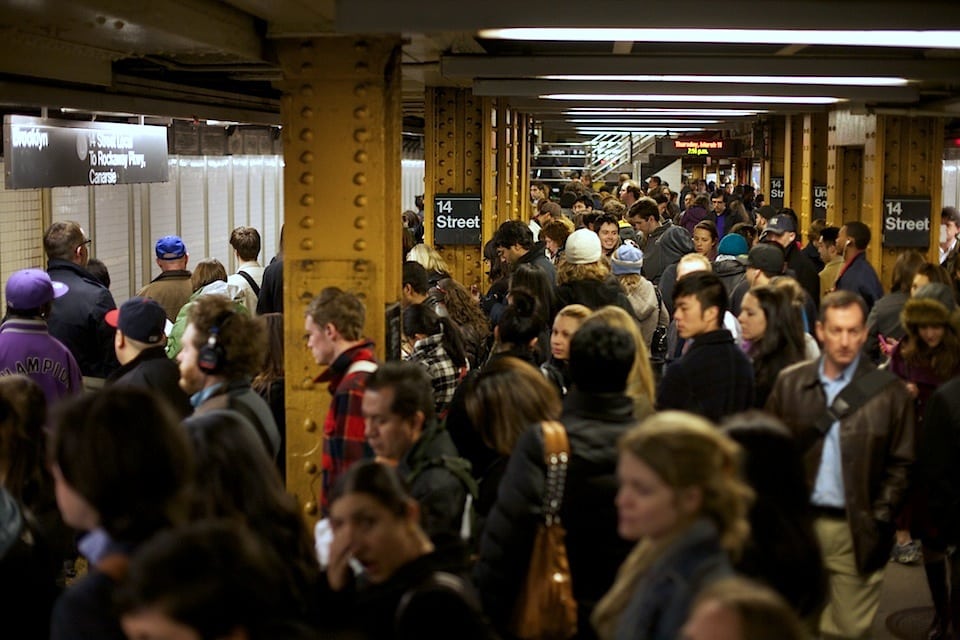
Photo Credit: A very crowded subway platform at the 14th Street platform in New York City. Flickr / Dan Phiffer
Skift Take
The significant increase in subway ridership underlines the importance of public transit today and highlights the city's responsibility to respond with improved service and features that make the NYC system on par with transit options offered around the world.
Annual subway ridership in New York City reached 1.708 billion in 2013, surpassing a 62-year high of 1.654 million recorded in 2012.
Weekend ridership reached an all-time high of 5.8 million passengers, beating the previous all-time weekend high recorded in 1946.
Weekday ridership reached 5.5 million, the highest since 1950.
Subway ridership is defined as all passengers, excluding NYC Transit employees, who enter the subway system.
The New York City subway system also had its busiest day on record in its 2013.
A total of 5,985,311 rides were taken on October 24, according t
