The Haves and Have Nots of U.S. State Tourism Budgets

Skift Take
The budgets for the top ten U.S. state tourism offices including Hawaii, Florida, California and Texas represent more than half, or 53.5 percent, of the total budget for all state tourism offices.
In the fiscal year that ended June 30, 2013, the average budget of those top ten states was $36.6 million while the average for the other 36 reporting states was just $8.8 million.
This is according to the U.S. Travel Association‘s 2012-2013 Survey of U.S. State Tourism Budgets released in late June.
State tourism budgets range from $710,000 for Rhode Island to $75 million for Hawaii. Public funding is the primary source of capital with state general funds and lodging and tourism sales tax receipts contributing 91.1 percent, or $622.8 million of the $683.6 million total budgets.
The report, however, only includes 46 provisional budgets for the 2012-2013 year, determined by a survey sent to each state tourism office. Skift has separately been collecting actual 2012-2013 budgets, which so far trend slightly higher than the provisional data.
Several interesting highlights from the report are as follows:
- Public-sector funds continued to be the primary funding source for state tourism offices and the sole source for 29 of 46 states.
- Marketing and promotion-related budgets totaled $405.4 million in FY 2012-13, a gain of $20.7 million or 5.4 percent from the $384.7 million allocated for marketing and promotion for FY 2011-12.
- Allocation of marketing dollars shifted, as budget intended for international efforts increased faster than domestic.
- The state of California still accounted for the largest share (31.5%) of total international marketing budget.
The 2012-2013 provisional budgets for state tourism offices are organized from largest to smallest budget below:
| State | Provisional FY 2012-13 Budget |
|---|---|
| Hawaii | $75 M |
| Florida | $56.2 M |
| Illinois | $55.4 M |
| California | $50 M |
| Texas | $37.2 M |
| Michigan | $27.4 M |
| Virginia | $17.6 M |
| Alaska | $17 M |
| Arkansas | $15.1 M |
| Wisconsin | $14.9 M |
| Nevada | $14.8 M |
| Colorado | $14.7 M |
| Utah | $14.4 M |
| South Carolina | $13.6 M |
| Louisiana | $13.2 M |
| Arizona | $12.9 M |
| Wyoming | $12.6 M |
| Montana | $12.3 M |
| South Dakota | $12.2 M |
| Oregon | $12 M |
| Tennessee | $11.7 M |
| Missouri | $11.6 M |
| Alabama | $11.6 M |
| Massachusetts | $10.9 M |
| Oklahoma | $10.7 M |
| North Carolina | $10.45 M |
| Maryland | $10.4 M |
| Maine | $9.8 M |
| New Jersey | $9 M |
| Minnesota | $8.5 M |
| West Virginia | $7.7 M |
| Kentucky | $7.4 M |
| Idaho | $7.2 M |
| New Mexico | $7.1 M |
| New Hampshire | $6.9 M |
| Georgia | $6.8 M |
| Mississippi | $6.4 M |
| Pennsylvania | $5.8 M |
| Nebraska | $5.2 M |
| North Dakota | $5.1 M |
| Ohio | $5 M |
| Vermont | $2.9 M |
| Iowa | $2.4 M |
| Indiana | $2.3 M |
| Delaware | $1.95 M |
| Rhode Island | $710 K |
| Connecticut | NA |
| Kansas | $4.8 M |
| New York | $19.1 M |
| Washington | NA |
| Total | $683.6 M |
| Average | $14.9 M |
Change in Total Tourism Budgets Over 12 Years
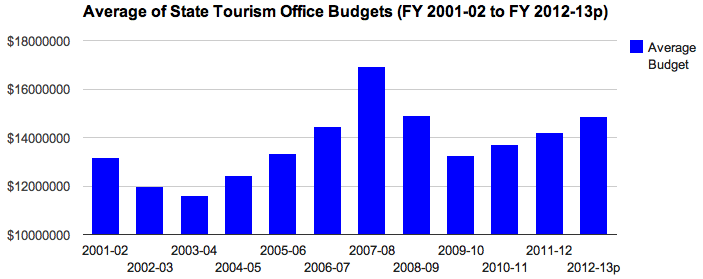
The average U.S. state tourism budget in 2013 was an estimated $14.9 million.
Averages have been trending upwards since 2010 when they dropped to $13.3 million after reaching a record $16.9 million in 2008.
Of the 46 reporting states, 11 state tourism budgets declined between 0.6 percent and 31.9 percent while 31 state tourism budgets increased between 0.3 percent and 126.4 percent. The greatest growth happened at the Arizona Office of Tourism.
A twelve-year comparison of average state tourism office budgets are highlighted in the below chart:
| Fiscal Year | Average Budget |
|---|---|
| 2001-02 | $13.2 M |
| 2002-03 | $12 M |
| 2003-04 | $11.6 M |
| 2004-05 | $12.4 M |
| 2005-06 | $13.3 M |
| 2006-07 | $14.4 M |
| 2007-08 | $16.9 M |
| 2008-09 | $14.9 M |
| 2009-10 | $13.3 M |
| 2010-11 | $13.7 M |
| 2011-12 | $14.2 M |
| 2012-13p | $14.9 M |


