3 Charts Showing Top Global Airlines For On-Time Performance in 2016

Skift Take
Some airlines make on-time performance a priority while others focus on other in-flight service standards but airline travel intelligence company OAG said Delta Air Lines and Qantas were clear winners in 2016 for keeping flights on schedule.
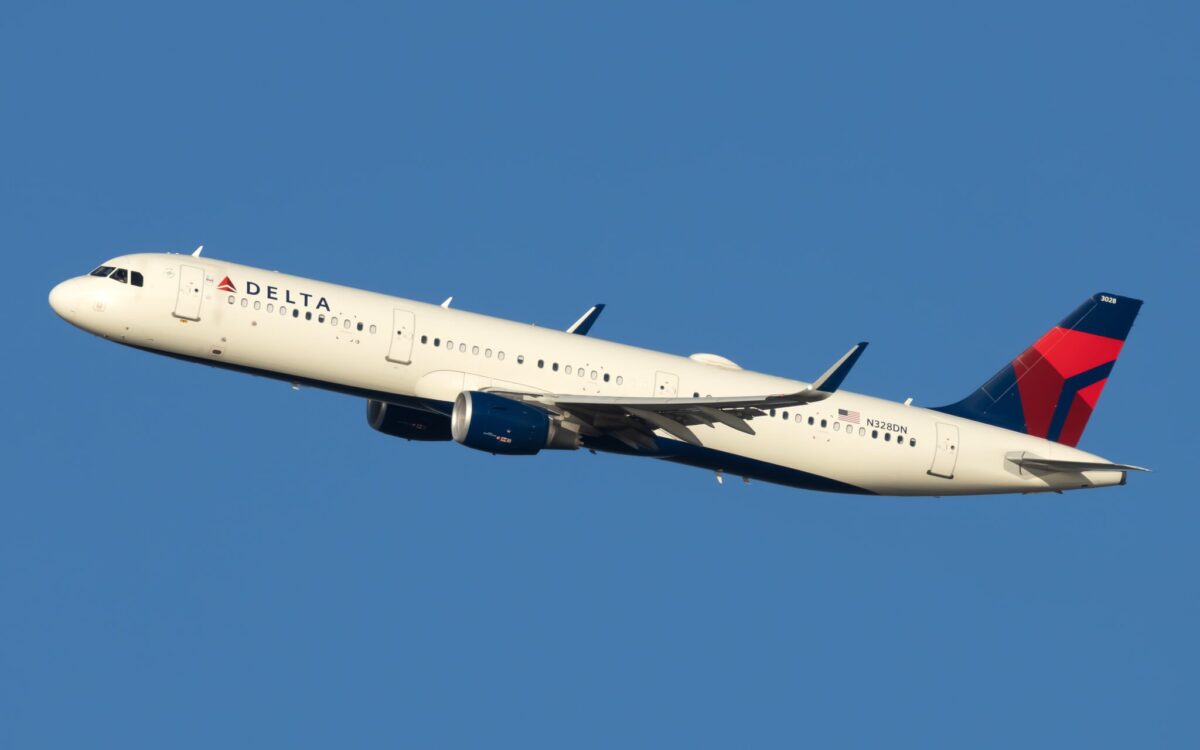
Delta’s on-time performance (84.29 percent) for full-year 2016 ranked ahead of the other two U.S. legacy carriers — American and United — and behind Hawaiian and Alaska Airlines, according to an OAG report that considered 54 million flights from hundreds of airlines that were operated last year.
OAG’s analysis points out Delta is the largest airline by most flights operated to make its top 20 ranking for most on-time airlines in 2016 and operated the second highest number of flights of any global airline last year. “The thing that stuck out to me more than anything is how strong Delta has been across four of their five major hub airports,” said John Grant, senior analyst at OAG. “We’ve seen that Delta has actually targeted on-time performance as a key differentiator, particularly against United. They’ve worked on it and it looks like it’s been very successful for them.”
Grant said Qantas has also made punctuality one of the main tenants of their turnaround program during the past two years. The airline, with 87.5 percent of its flights on-time, was the most on-time for Asia-Pacific carriers and the fourth most on-time overall. “Punctuality performance and restoring business travelers’ faith has been a part of this journey,” he said.
Though Delta, Qantas and other carriers made improvements this year that shouldn’t overshadow the fact that many mainline carriers have regional counterparts that usually help out the most with punctuality, for example, and can outweigh poor performance on mainlines, such as United Express and United. A new law that takes effect this year will require major U.S. carriers to report on-time performance of half a dozen regional carriers as regulators aim to make monthly performance at the major carriers reflect how well their regional operations did.
Making sure airlines stay on schedule is more important than ever as mainline carriers increasingly face heat from low-cost competitors that threaten to take on their turf and disrupt the market, said Grant. “As we see more low-cost long-haul and we see greater commoditization of that economy product between the mainstream long-haul airlines and low-cost long-haul airlines as they continue to emerge punctuality is going to be a key differentiator.”
There is no shortage of factors that influence airline punctuality and the past year had plenty of examples, from French air traffic control strikes to Lufthansa’s crew strikes to Delta’s network failure. But airlines committed to getting in on-time throughout the year usually recover from these singular, isolated events, said Grant.
Below we look at the full ranking for the top 20 global airlines, low-cost carriers and airports.
Chart 1: Hawaiian Airlines was the most on-time airline in 2016 with 89.8 percent of flights arriving on time, likely thanks to favorable weather.
| Rank | Airline | On-Time Performance in 2016 |
|---|---|---|
| 1 | Hawaiian Airlines | 89.87% |
| 2 | Copa Airlines | 88.75% |
| 3 | KLM | 87.75% |
| 4 | Qantas Airways | 87.56% |
| 5 | Japan Airlines | 86.74% |
| 6 | Flybe | 86.62% |
| 7 | Alaska Airlines | 86.05% |
| 8 | Iberia | 85.67% |
| 9 | Monarch Airlines | 85.67% |
| 10 | Sinapore Airlines | 85.19% |
| 11 | Austrian Airlines | 84.89% |
| 12 | All Nippon Airways | 84.71% |
| 13 | GOL | 84.63% |
| 14 | Virgin Australia | 84.52% |
| 15 | Delta Air Lines | 84.29% |
| 16 | Finnair | 84.12% |
| 17 | Transavia | 83.98% |
| 18 | Aer Lingus | 83.97% |
| 19 | Gulf Air | 82.70% |
| 20 | Jet2.com | 82.60% |
Chart 2: Several European and Asian low-cost carriers rank at the top of the low-cost ranking while U.S. low-cost carriers rank towards the bottom.
| Rank | Airline | On-Time Performance in 2016 |
|---|---|---|
| 1 | Monarch Airlines | 85.67% |
| 2 | GOL | 84.63% |
| 3 | Transavia | 83.98% |
| 4 | Jet2.com | 82.64% |
| 5 | germanwings | 82.48% |
| 6 | Westjet | 81.36% |
| 7 | Southwest | 81.04% |
| 8 | Norwegian Air Shuttle | 79.23% |
| 9 | Thai AirAsia | 78.60% |
| 10 | Skymark Airlines | 78.32% |
| 11 | Eurowings | 77.88% |
| 12 | Frontier Airlines | 76.70% |
| 13 | Virgin America | 76.40% |
| 14 | IndiGo Air | 75.27% |
| 15 | JetBlue | 75.26% |
| 16 | easyJet | 74.73% |
| 17 | Spring Airlines | 74.50% |
| 18 | Spirit Airlines | 73.92% |
| 19 | Jetstar Airways | 73.66% |
| 20 | AirAsia | 73.50% |
Chart 3: Some 11 of the top 20 major airports for best on-time performance in 2016 are U.S. airports, including Detroit, Atlanta and Dallas Fort/Worth.
| Rank | Airport | On-Time Performance in 2016 |
|---|---|---|
| 1 | Tokyo Haneda | 87.49% |
| 2 | Sao Paulo Guarulhos | 85.28% |
| 3 | Detroit | 84.64% |
| 4 | Atlanta Hartsfield-Jackson | 84.67% |
| 5 | Minneapolis | 84.46% |
| 6 | Seatle-Tacoma | 83.74% |
| 7 | Moscow Sheremetyevo | 83.52% |
| 8 | Singapore Changi | 83.49% |
| 9 | Munich | 82.85% |
| 10 | Phoenix | 82.82% |
| 11 | Charlotte | 82.36% |
| 12 | Houston George Bush | 82.21% |
| 13 | Sydney | 81.81% |
| 14 | Denver | 81.21% |
| 15 | Frankfurt | 81.17% |
| 16 | Madrid Barajas | 80.93% |
| 17 | Dallas/Fort Worth | 80.16% |
| 18 | Orlando MCO | 80.12% |
| 19 | Las Vegas | 80.11% |
| 20 | Amsterdam Schiphol | 79.77% |
Source: OAG


