Transportation Spending Grabs Smaller Share of Household Income in Sharing Economy Era
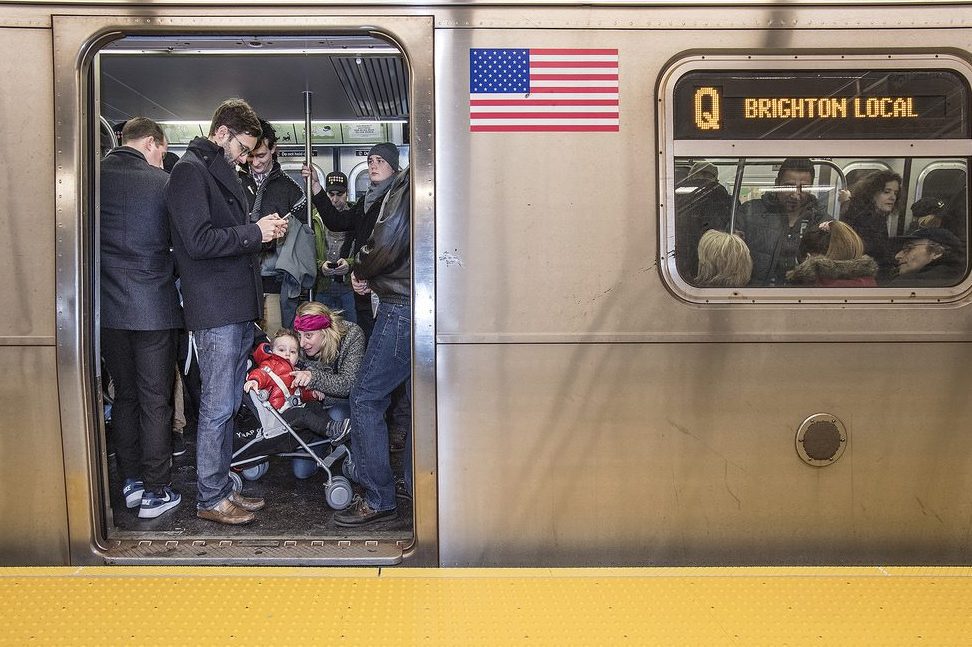
Photo Credit: Riders on the subway in New York City. As a share of income, transportation spending in the U.S. has declined since 1989. Flickr / Metropolitan Transportation Authority
Skift Take
The democratization of travel in the U.S. has led to a smaller share of spending on cars and transportation over the last 30 years. It's disheartening, though, that transportation costs still account for the second largest spending bucket for U.S. residents.
It's common knowledge that the wages of U.S. workers have stagnated over time, making essentials more expensive than they were in the past.
Yet U.S. households are spending a smaller share of income on transportation today than they did in the 1980s, a sign of reduced automobile usage and the entry of ride-sharing services into the consumer mainstream.
New research from Michael Sivak and Brandon Schoettle at the University of Michigan's Sustainable Worldwide Transportation department finds that personal transportation sp
