The State of Global Tourism Competition in 6 Charts
Skift Take
While many travel industry brands have introduced more eco-friendly practices and made it easier for travelers to enter a destination, tourists around the world are increasingly concerned with their carbon footprints and destinations' level of openness as the U.S. travel ban weighs on minds of global travelers.
Tourists spend more in destinations when they perceive them to have sustainable or environmental-friendly practices in place, according to the World Economic Forum's 2017 Travel & Tourism Competitiveness Report.
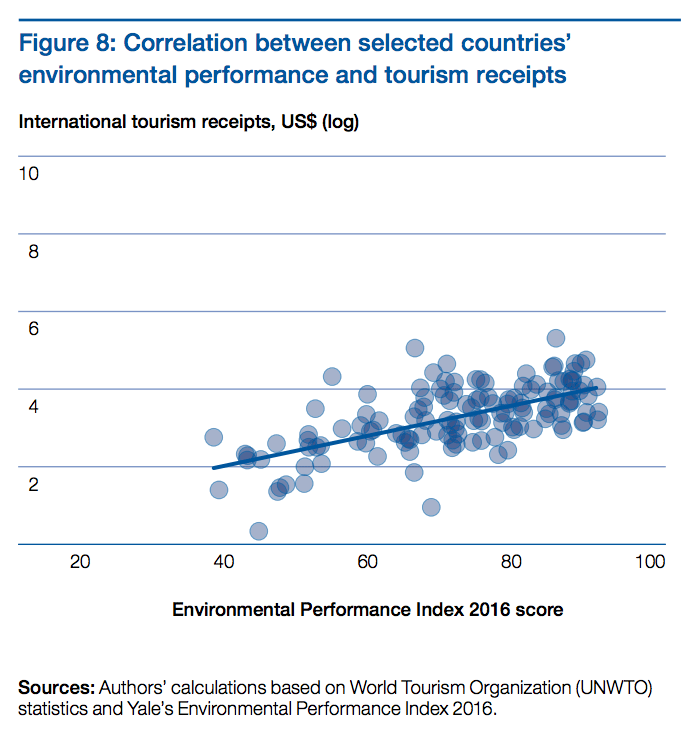
"Although this relationship is complex, and there is no evidence of direct causality, the more pristine the natural environment of a country, the more tourists are inclined to travel there, and the more they are willing to pay to access well-preserved areas," the report states. "Consequently, as the natural capital depletes, destinations lose revenue."
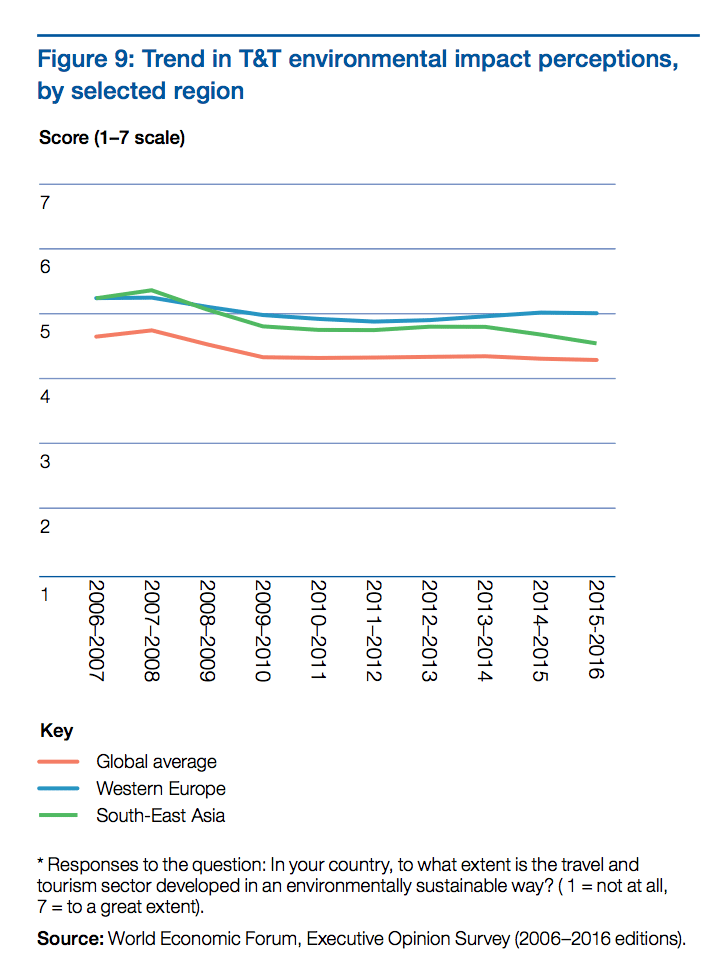
But according to the Executive Opinion Survey, which is based on a survey of about 100 business executives in each of the 136 countries analyzed for the report, many business executives and travelers perceived the travel industry as less environmentally friendly in 2016 than they did in 2006.
Some 17 of the top 20 countries ranked for environmental sustainability are in Europe including Switzerland, Norway, and Iceland. "Globally, there is little sign of
improving travel and tourism development standards," the report states. "In
particular, the footprint of the sector has been reduced in the majority of countries of Northern and Western Europe while it has increased in most developing nations, especially in Asia."
Visa Requirements
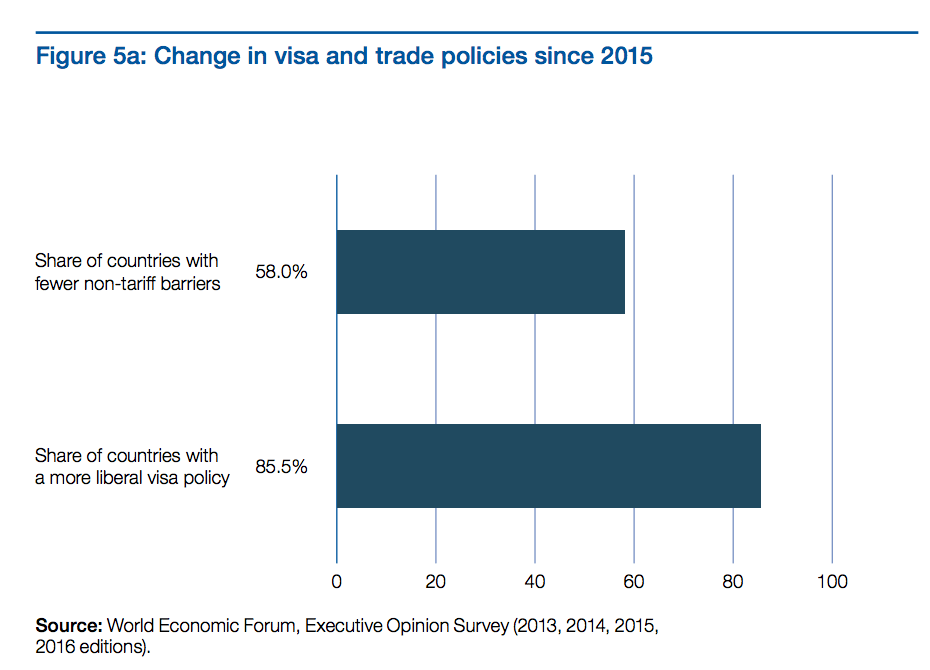
Visa requirements also weigh heavily on travelers' decisions to visit destinations. In 2015, tourist destinations worldwide required 61 percent of the world’s population to obtain a visa prior to departure -- an improvement from 2008 when 77 percent of the world’s population needed a visa to visit a given destination.
Speaking at Skift Forum Europe in London last week, Gerald Lawless, head of tourism and hospitality for Dubai Holding and chairman of the World Travel & Tourism Council, said a global trusted travel program is something the travel industry should pursue. "You could go through the fast lane in these blocks of countries that participate, why shouldn't we try to combine this?" said Lawless. "India just introduced visa on arrival and Dubai just gave visa-free travel to China."
Electronic visa systems have proven effective and should be widely implemented, Lawless said. "Fifteen years ago we persuaded visa authorities in Dubai to give visa waivers to 32 countries that weren't threats," he said. "But we asked them not to ask for reciprocity from the other countries and it's taken 10 to 15 years for reciprocal visa policies from the Schengen block to the UAE."
U.S. and Canada, for example, don't want to recognize some European countries for their visa waiver programs. "Therefore the EU by its own laws needs to take reciprocal action," said Lawless. "We ask politicians to be sensible and it takes effort and will on both sides. Don't do things just for political reasons."
Below are six charts that display how 136 countries compare to business executives' and travelers' perceptions of hotel infrastructure, airport infrastructure, destinations' degrees of openness and how the travel industry is working to combat negative side effects of tourism.
Interestingly, the U.S. and European countries scored high rankings for tourism infrastructure and aviation infrastructure, but scored lower for perceptions of openness as waves of populism have swept across both regions in the past year.
Destinations such as France and Belgium also ranked lower than Latin American, Asian or African destinations in some cases such as safety and security following terrorist attacks in both countries in the past year.
Chart 1: Western Europe is perceived to have high-quality tourism infrastructure including hotels, car rental availability and solid financial institutions that tourists rely on.
Quality of Tourism Infrastructure (hotels, car rentals, ATMs, etc.)
| Rank | Country | Score (1 to 7, 7= highest) |
|---|---|---|
| 1 | Austria | 6.67 |
| 2 | Spain | 6.66 |
| 3 | U.S. | 6.59 |
| 4 | Portugal | 6.37 |
| 5 | Croatia | 6.26 |
| 6 | Switzerland | 6.2 |
| 7 | UK | 6.16 |
| 8 | Australia | 6.06 |
| 9 | Germany | 6 |
| 10 | Canada | 5.97 |
| 11 | Italy | 5.96 |
| 12 | Luxembourg | 5.91 |
| 13 | Iceland | 5.82 |
| 14 | Bulgaria | 5.8 |
| 15 | Ireland | 5.76 |
| 16 | Thailand | 5.76 |
| 17 | France | 5.7 |
| 18 | Greece | 5.7 |
| 19 | New Zealand | 5.69 |
| 20 | Cyprus | 5.3 |
Chart 2: U.S. airports have gotten a bad rep for their aging and deteriorating conditions but U.S. airports and airlines still managed a number two ranking when considering each country's airport infrastructure and airline connectivity.
Quality of Aviation Infrastructure (airport infrastructure and air connectivity)
| Rank | Country | Score (1 to 7, 7=highest) |
|---|---|---|
| 1 | Canada | 6.76 |
| 2 | U.S. | 5.96 |
| 3 | UAE | 5.84 |
| 4 | Australia | 5.69 |
| 5 | Hong Kong | 5.52 |
| 6 | Singapore | 5.29 |
| 7 | Norway | 5.28 |
| 8 | UK | 5.2 |
| 9 | Spain | 5 |
| 10 | Netherlands | 4.95 |
| 11 | Switzerland | 4.94 |
| 12 | Germany | 4.92 |
| 13 | France | 4.9 |
| 14 | Turkey | 4.74 |
| 15 | New Zealand | 4.7 |
| 16 | Panama | 4.69 |
| 17 | Iceland | 4.69 |
| 18 | Japan | 4.6 |
| 19 | Sweden | 4.59 |
| 20 | Thailand | 4.56 |
Chart 3: Singapore ranks highest for its ease of visa requirements and general perception of openness to travelers. Other Asia-Pacific destinations such as Australia, Japan and Indonesia ranked higher than France or the UK, for example. Chile, Colombia, El Salvador and Panama in Latin America also ranked in the top 10.
Perception of International Openness (visa requirements, bilateral aviation agreements, regional trade agreements in place)
| Rank | Country | Score (1 to 7, 7=highest) |
|---|---|---|
| 1 | Singapore | 5.21 |
| 2 | Australia | 4.77 |
| 3 | Chile | 4.65 |
| 4 | Colombia | 4.64 |
| 5 | New Zealand | 4.52 |
| 6 | El Salvador | 4.51 |
| 7 | Ireland | 4.51 |
| 8 | Panama | 4.44 |
| 9 | Iceland | 4.4 |
| 10 | Japan | 4.38 |
| 11 | Denmark | 4.36 |
| 12 | Peru | 4.3 |
| 13 | Nicaragua | 4.29 |
| 14 | Korea | 4.28 |
| 15 | Luxembourg | 4.27 |
| 16 | Netherlands | 4.27 |
| 17 | Indonesia | 4.27 |
| 18 | Germany | 4.26 |
| 19 | France | 4.24 |
| 20 | UK | 4.24 |
Chart 4: Global visa policies are becoming more lenient -- some 85.5 percent of countries have a more liberal visa policy in 2017 compared to 2015.
Chart 5: Overall, global travelers' perceptions of the travel industry's environmental impact on destinations have worsened during the last decade as millions more tourists cross borders each year. Research suggests that tourists tend to consume around three to four times more water per day than permanent residents, the report states.
Chart 6: The report found that the environmental strength of a country is directly related to tourism revenue and tourists spend significantly more if a country is perceived as environmentally-friendly.
Source: World Economic Forum
Skift’s in-depth reporting on climate issues is made possible through the financial support of Intrepid Travel. This backing allows Skift to bring you high-quality journalism on one of the most important topics facing our planet today. Intrepid is not involved in any decisions made by Skift’s editorial team.
