Passenger Satisfaction With U.S. Airlines Hits a 10-Year High

Skift Take
Flyers are more satisfied with their airline experience than they've been in the last decade, and its not just because fares have decreased, according to J.D. Power's 2016 North America Airline Satisfaction Study.
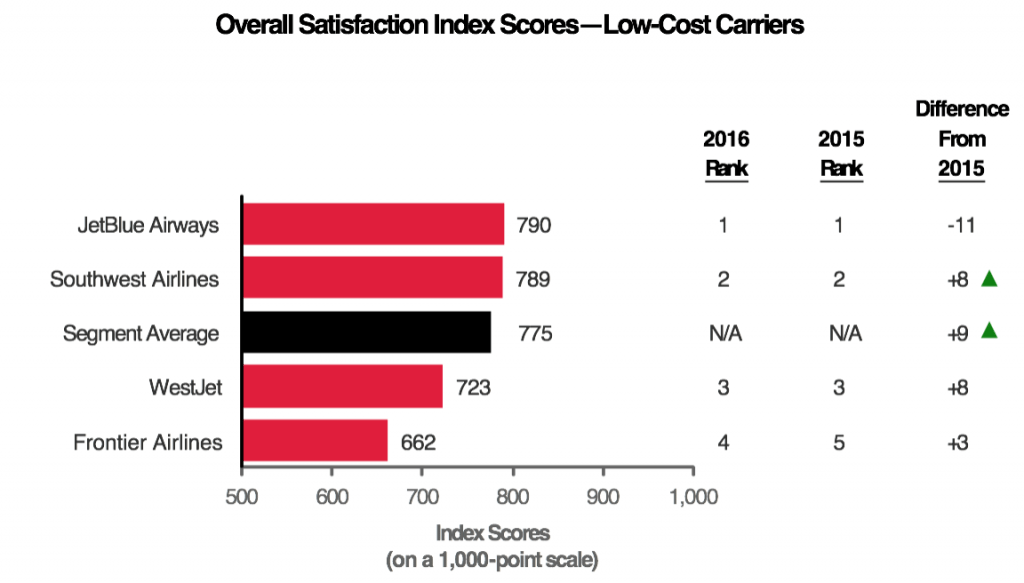
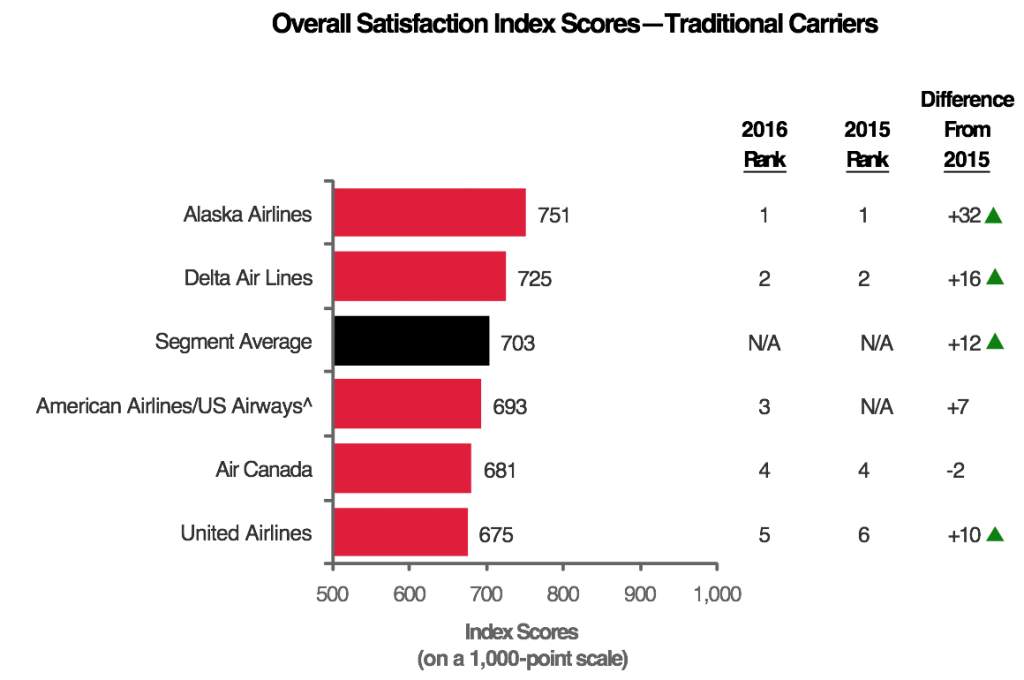
Now that the major U.S. airlines are profitable, they're putting money back into the customer experience. JetBlue is ranked number one in overall satisfaction, followed by Southwest Airlines and Alaska Airlines.
"Airline performance is finally getting better in a lot of operational respects and we know that airlines are really making money now," said Rick Garlick, global travel and hospitality practice lead at J.D. Power. "It's nice to see that they're actually investing that into new aircraft and in-flight services. They're adding a lot of value for the customer. Our data show that individuals are having a greater tolerance for these increased fees; the satisfaction of people who say they had to pay for bags and other services went up."
J.D. Power's research found that flyers report higher satisfaction levels overall on low-cost carriers, and that loyalty program members are happier travelers than those who aren't.
Here are several takeaways from the report:
Overall, consumer satisfaction with airlines is the highest in a decade
| Category | 2016 | 2015 | 2014 | 2013 | 2012 | 2011 | 2010 | 2009 | 2008 | 2007 |
|---|---|---|---|---|---|---|---|---|---|---|
| Overall Satisfaction Index | 726 | 717 | 712 | 695 | 681 | 683 | 673 | 658 | 668 | 687 |
| Reservation | 815 | 816 | 812 | 804 | 797 | 799 | 778 | 767 | 764 | 785 |
| Check-In | 831 | 826 | 825 | 820 | 805 | 807 | 761 | 755 | 753 | 760 |
| Boarding / Deplaning / Baggage | 776 | 767 | 761 | 752 | 735 | 739 | 720 | 705 | 710 | 734 |
| Aircraft | 718 | 704 | 700 | 684 | 669 | 656 | 652 | 643 | 648 | 673 |
| Flight Crew | 803 | 792 | 783 | 771 | 758 | 753 | 721 | 707 | 721 | 753 |
| In-Flight Services | 650 | 638 | 632 | 606 | 596 | 593 | 583 | 563 | 581 | 607 |
| Cost & Fees | 658 | 646 | 642 | 618 | 606 | 610 | 629 | 609 | 622 | 637 |
Examining the report's data over the last decade, every satisfaction category is at an historic high, except for satisfaction with reservations which barely missed the mark.
It's likely that lower fares have helped make increased ancillary fees more tolerable to flyers.
"It's a consistent story across the industry that service is getting better," said Garlick. "Everybody likes to complain and take that moment to be critical, but airlines deserve some credit for doing some good things."
JetBlue leads the low-cost pack but Southwest very close
JetBlue and Southwest outperform their traditional competitors according to the satisfaction index. While JetBlue's satisfaction has dropped year-over-year, it still remains best in the segment. One has to wonder whether JetBlue's introduction of bag fees on some fares had something to do with its decreased satisfaction score.
"Obviously the fact that JetBlue and Southwest do have a lower cost model does certainly help drive satisfaction [compared to legacy carriers], but both of those companies have truly unique service cultures," said Garlick.
Alaska Airlines dominates the big 3 carriers
Among traditional U.S. airlines, Alaska Airlines beats out giants like Delta Air Lines and American Airlines. In fact, American and United Airlines have lower satisfaction scores than the segment average.
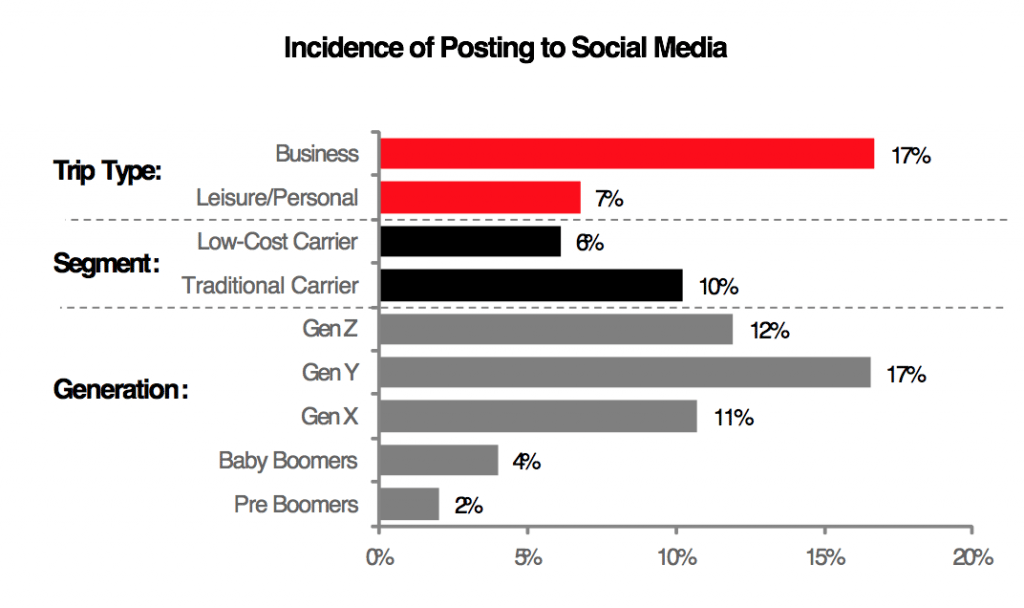
Gen Y Business Travelers Are Most Likely to Post on Social Media
The report's section on social media shows that business travelers are more likely than leisure travelers to post on social media about their trip. The vast majority overall post to Facebook, which far exceeded Twitter use overall.
"We all recognize that social media has really emerged as a feedback tool of choice," said Garlick. "Unstructured social media content is what everyone is paying attention to. When you post on social media, even when you don't get your issue resolved you feel good that someone even responded to you."
Interestingly, flyers tend to be satisfied if their social media posts about problems are merely responded to by airline representatives, if not actually solved.
Airline loyalty program members are more satisfied flyers
| Leisure/Personal | Business | |||||
|---|---|---|---|---|---|---|
| Category | Non-Member | General Member | Status Member | Non-Member | General Member | Status Member |
| Overall Satisfaction Index | 698 | +39 | +22 | 728 | -9 | +42 |
| Reservation | 769 | +58 | +9 | 791 | +32 | +22 |
| Check-In | 795 | +54 | +9 | 792 | +37 | +26 |
| Boarding / Deplaning / Baggage | 754 | +30 | +13 | 771 | +1 | +24 |
| Aircraft | 694 | +22 | +42 | 738 | -24 | +52 |
| Flight Crew | 780 | +33 | +13 | 784 | +5 | +30 |
| In-Flight Services | 630 | +16 | +44 | 692 | -42 | +62 |
| Cost & Fees | 625 | +51 | +18 | 665 | -19 | +43 |
A look at airline loyalty status finds that airline loyalty members end up way more satisfied with flights than passengers who aren't members.
"The one thing that really seems to matter to business travelers is efficiency and the ability to be productive on the plane," said Garlick. "Obviously everyone cares about space and the ability to have a comfortable seat, but one thing that's key to satisfaction for business travelers is power plugs under the seat."
