Skift Research’s 5 Favorite Charts of 2023


Photo Credit: The travel industry still has mountains to climb en route to a full recovery. Getty Images / Buena Vista Images
Skift Take
While we're sure your parents love all their children equally, for our analysts, there’s always a data story that stands out.
It’s been a momentous year for the travel industry and the Skift Research team. Across our 50-plus reports, we created hundreds of charts to visualize the data behind the travel industry.
We love them all. And, dear reader, while we’re sure your parents love all their children equally, for our analysts, there’s always a certain takeaway, or chart pattern, or data story that stands out above the rest.
To look back on the year that was, we asked the Skift Research team to share their favorite charts: Here are the top five, chosen by the analysts that created them.
Pranavi Agarwal, Senior Research Analyst
Google’s Role in Democratizing Travel Search
excerpted from: A Deep Dive into Google Travel Part I: U.S. Hotel Distribution
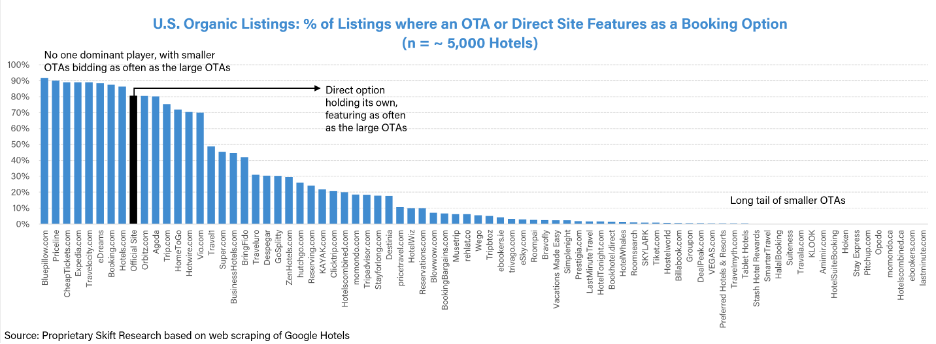
“Our proprietary web scraping analysis of Google Hotels shows that Google’s introduction of organic results is leveling the distribution playing field – allowing the direct site and smaller OTAs opportunity to compete head-on with Booking and Expedia. Whilst the largest OTAs dominate the paid-sponsored listings, in the free organic results, there is no one commanding player, with Expedia.com and Booking.com as likely to appear as the official direct site and OTAs such as cheaptickets.com and bluepillow.com.” – Pranavi Agarwal
Varsha Arora, Research Manager
Affluent Travelers’ Favorite Parts of the Travel Experience
excerpted from: The Luxury Traveler: Survey Findings
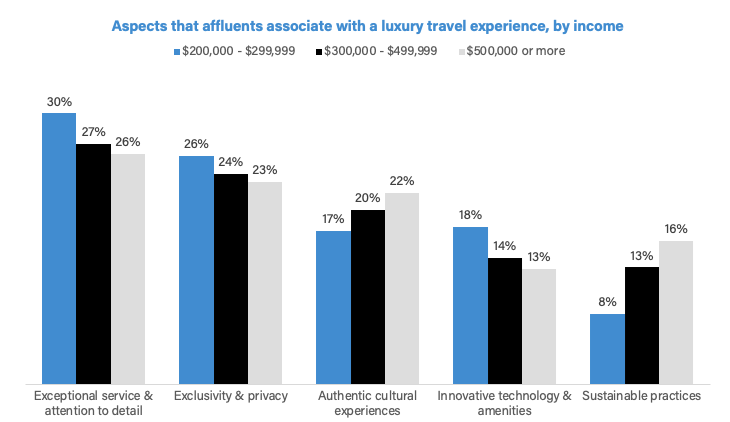
“The chart illuminates a nuanced understanding of luxury travel preferences across income brackets. Notably, exceptional service and attention to detail consistently emerge as top priorities for all income groups, forming a universal definition of luxury. However, as income increases, the emphasis on exclusivity and innovation slightly diminishes, while the significance of authentic cultural experiences and sustainability rises. This shift implies that higher-income individuals place greater importance on fostering a deeper connection with culture and demonstrating environmental consciousness in their luxury travel experiences, challenging conventional notions of luxury solely tied to exclusivity and innovation.” – Varsha Arora
Seth Borko, Head of Skift Research
Travel Transitions from Hypergrowth to Normalized Revenue Growth
excerpted from: Skift Travel 200 Stock Index Data

“This chart aggregates revenue data from the 200 largest publicly traded travel companies to give an overview of how ‘swingy’ growth rates have been for our industry over the past three years. After a collapse in 2020 that saw industry revenue fall 80%, 2021 gave way to a strong rebound. This period of hypergrowth lasted through 2022 and into this last year. But the COVID “new normal” is going to give way to plain old normal in 2024. We have to remember that this can still be a period of strength for the travel industry, but revenue growth won’t be anywhere near as fast as it was during the post-pandemic rush.” – Seth Borko
Ashab Rizvi, Research Analyst
Business Class Revenues Have Recovered Much Faster Than Capacity
excerpted from: Business Class Recovery: State of Airline Premium Cabin Capacity

“This is my favorite chart since the data all comes from our quant model – a first in the industry where we have evaluated capacity and revenues by cabin classes. This creates a unique analysis of capacity and revenue recovery from two major cabin classes (Business and Economy) across four different regions (North America, Europe, Middle East, and Asia). Notably, North America has emerged as the frontrunner in terms of capacity recovery, with an impressive 94% overall recovery rate. The remaining regions have exhibited significant disparities, with Europe experiencing a decline to 77%, the Middle East to 65%, and the Asia Pacific region to a mere 50% of its 2019 levels.” – Ashab Rizvi
Saniya Zanpure, Research Analyst
Domestic Tourism Fuels Travel Rebound
excerpted from: Skift Travel Health Index
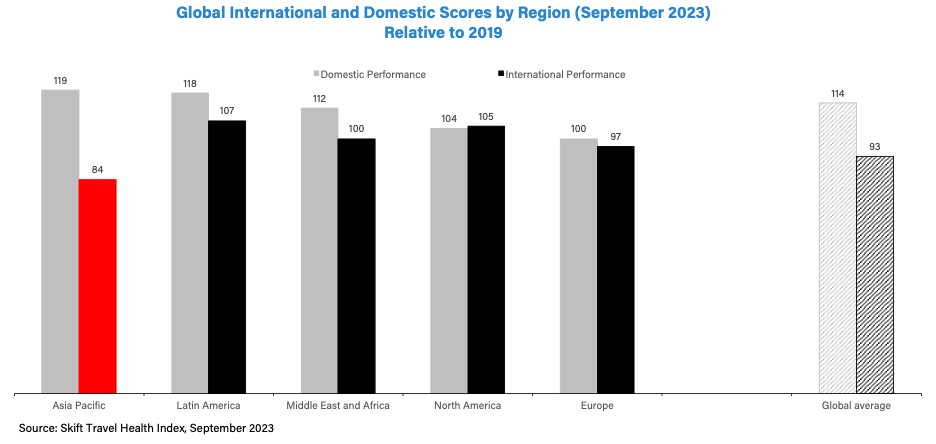
“Domestic travel has driven global travel recovery. While international travel in most regions is back, indicators show that international travel in Asia Pacific has only recovered 84% of 2019 levels.” – Saniya Zanpure
If you’re not a subscriber yet, sign up to Skift Research to get access to all of the above reports, as well as all the exciting research the team will produce in 2024.