3 Charts That Better Explain Airbnb in New York City
Skift Take
Late Friday, Airbnb announced that it would drop its lawsuit against New York City, which means that hosts may soon face large fines for listing their residences on sites including Airbnb and its peers.
Below is an excerpt from our Skift Trends Report, The State of Alternative Accommodations 2016. Get the full report here to stay ahead of this trend.
Airbnb’s relationship with the city of New York has been rocky from the start for a number of reasons. In New York, opponents of Airbnb not only include hotel industry lobbyists but affordable housing advocates and hotel unions, as well. As it stands now, the majority of its listings in New York City (54 percent according to Airbnb’s own data) are illegal because they are for entire homes/apartments and are being rented for less than 30 days, which is a violation of the city’s 2010 Multiple Dwelling Law. Following Airbnb's decision on Friday to drop its opposition to the law, the city may begin to fine hosts who use Airbnb and its peers to advertise illegal listings on those sites, with fines ranging from $1,000 to $7,500 per violation.
Concentration of Listings in New York
Preview and Buy the Full Report
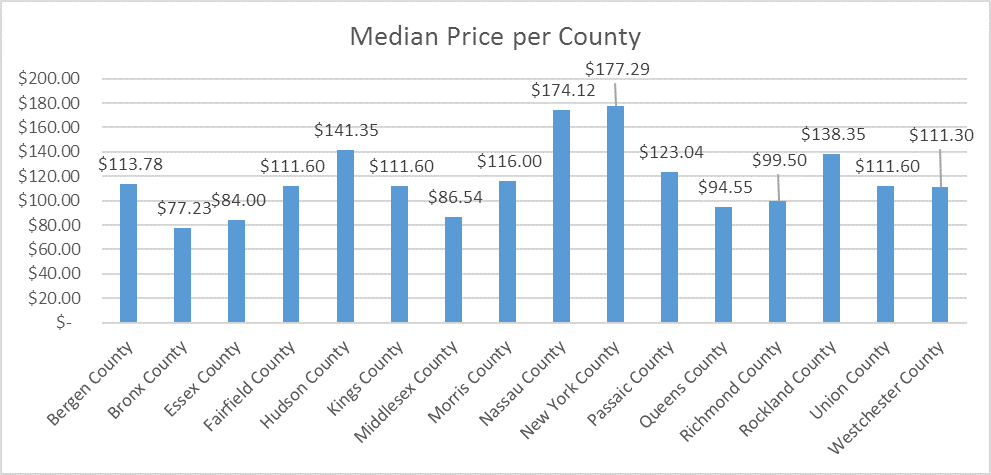
New York has 49,505 alternative accommodation listings on a regional level, 87% of which are listed on Airbnb. When narrowing our focus on New York County, Kings County, and Queens County the number of listings takes just a small decline to 41,716. In this section we look at the concentration of listings throughout the Metro area, and we also look at the median price based on Zip Codes, which allows for deeper insight into the pricing situation throughout New York areas.
In New York the vast majority of listings are concentrated within the borough of Manhattan, which also sees the highest prices per listings.
Median Price in New York
Preview and Buy the Full Report
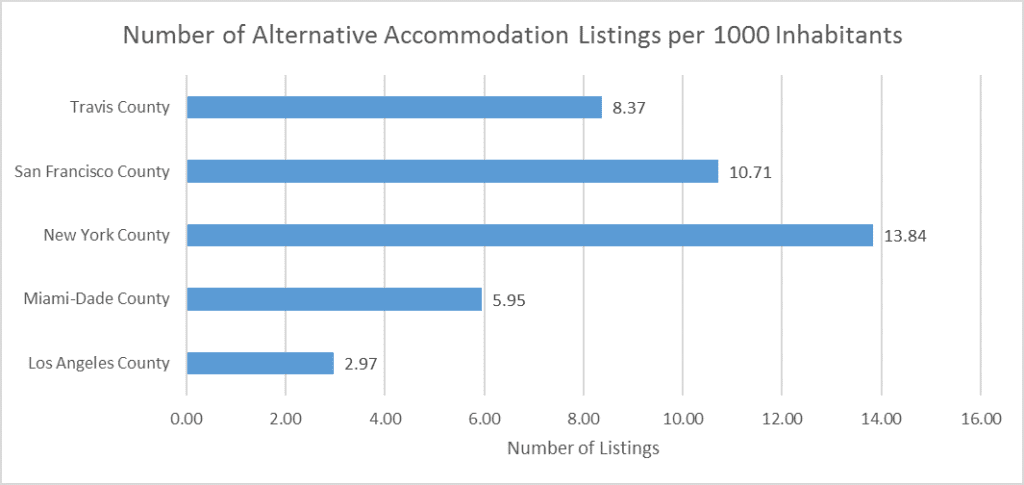
While Los Angeles has the highest total number of listings, New York County, which represents the borough of Manhattan, has the highest relative density with just short of 14 listing’s per 1,000 inhabitants. San Francisco County claims second place at 10.7 per 1,000 inhabitants.
Subscribe now to Skift Trends Reports
This is one of our latest in a series of twice-monthly reports aimed at analyzing the fault lines of disruption in travel. These reports are intended for the busy travel industry decision maker. Tap into the opinions and insights of our seasoned network of staffers and contributors. Over 100 hours of desk research, data collection, and/or analysis goes into each report.
After you subscribe, you will gain access to our entire vault of reports conducted on topics ranging from technology to marketing strategy to deep-dives on key travel brands. Reports are available online in a responsive design format, or you can also buy each report a la carte at a higher price.


