Skift Take
How travelers feel about their destination experiences correlate to how much they spend and how many positive recommendations they'll make. JD Power's study is likely a wake-up call for U.S. destinations trying to measure these relationships.
Tourism marketers spend just as much time working to get first-time travelers to book a vacation as they do convincing them to return, though destinations may be surprised that nearly one-third of U.S. travelers are likely disappointed with or indifferent to their destination experiences.
That’s according to JD Power and Associates’ new study on travelers’ sentiments toward their destination experiences and it seeks to measure traveler spending. JD Power conducted the online survey between February and April 2016 and it includes more than 13,000 respondents who are ages 18 and older, live in the U.S. and traveled to a top 50 U.S. destination more than 50 miles from their home during the past 60 days. STR, a hotel data company, determined the top 50 U.S. destinations by number of hotel room nights sold. Data represents trips taken between December 2015 and April 2016.
Some 52 percent of those surveyed are millennials born between 1977 and 1994, and 71 percent said they are repeat visitors to their destinations.
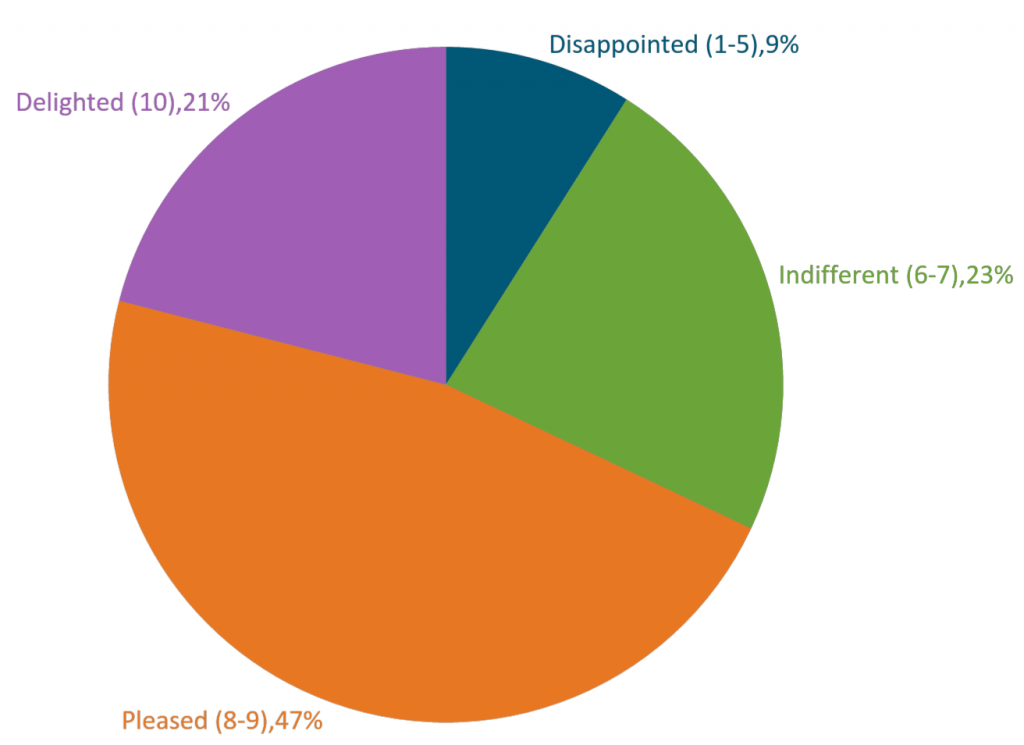
Nearly half of respondents said they were pleased with their destinations and 21 percent said they were delighted. “Delighted” means virtually nothing went wrong and the destination was as close to perfect as it could get, while “pleased” means the traveler may have experienced a minor problem related to the destination that didn’t spoil the experience. JD Power defined “disappointed” and “indifferent” as travelers indicating they either had multiple destination-related problems or were unimpressed with available offerings.
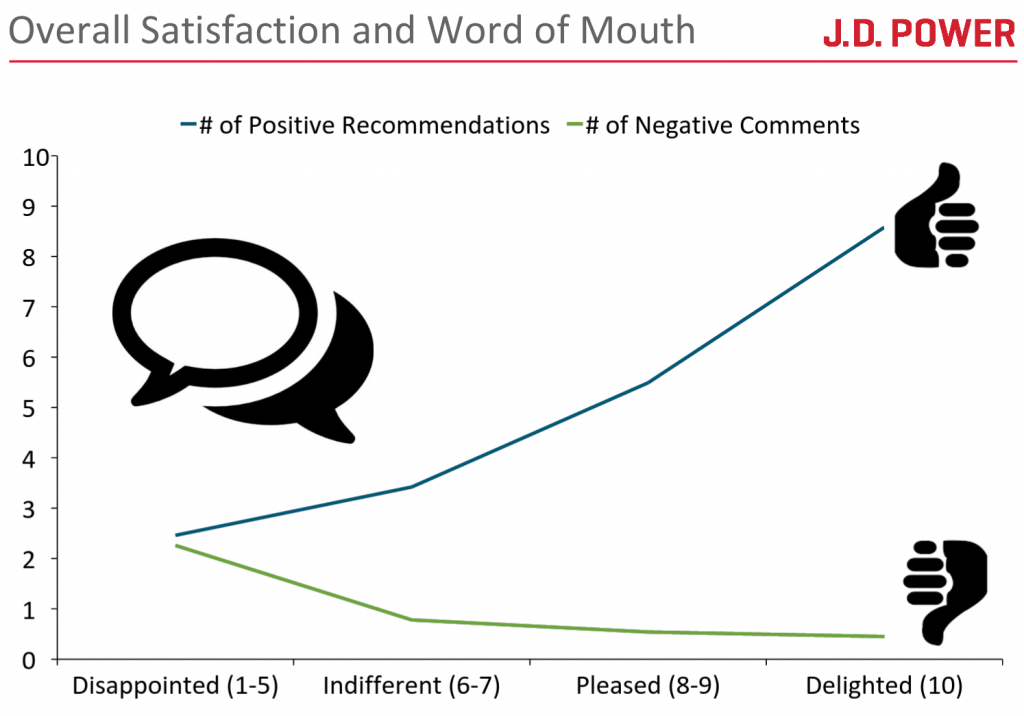
Respondents also said more than 70 percent of their destination-related comments on Facebook, Twitter, Instagram, YouTube and TripAdvisor were positive. Those who are disappointed make far fewer negative recommendations than those who are delighted make positive ones, according to the study (see Chart 5 below).
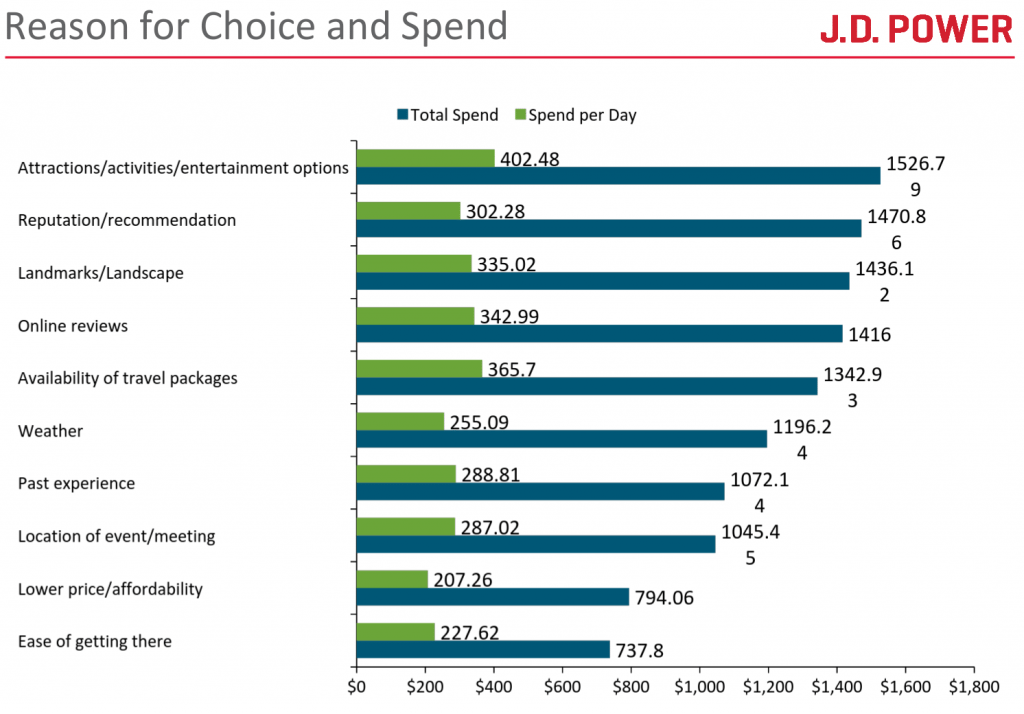
Travelers’ spending is also influenced by the reason they chose to visit the destination. For example, respondents who said they visited because of attractions spent the most per day ($402 on average) and $100 more per day than those who visited because of personal recommendations and $60 more per day than those who visited because of what they read on online review sites.
Chart 1: Nearly half of respondents indicated that they were “pleased” with the experience they had in their destination while nearly one-third said they were indifferent or disappointed.
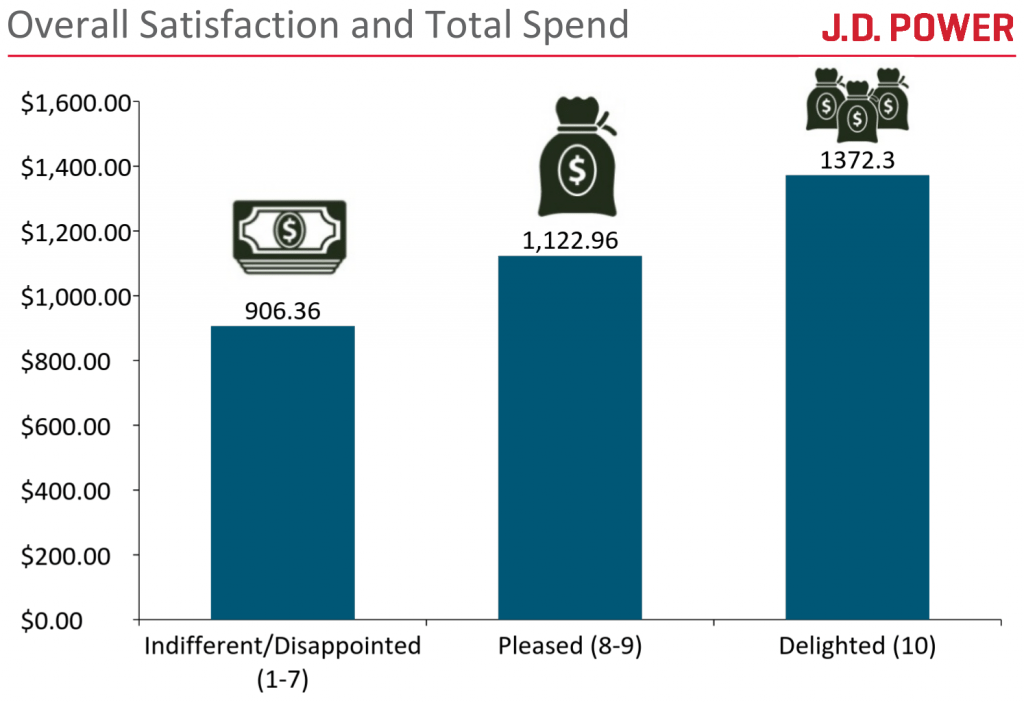
Chart 2: While “pleased” was the strongest sentiment among respondents, those who were pleased with their destinations on average spent $150 less than those who said they were delighted.
Chart 3: Respondents that said they chose their destinations based on the attractions and activities they planned to do spent more than travelers choosing their destinations for any other reason. Note that while attractions had a greater spend per day than reputation/recommendations, for example, the overall difference in spend is only $56.
Chart 4: Nearly half of respondents that were disappointed or indifferent still said they would definitely return to the destination and 44 percent of these respondents said they probably will return, showing destinations that a bad experience doesn’t necessarily equal no redemption. But given 71 percent of the study’s respondents were repeat visitors, they had likely already grown attached to the destination and perhaps their bad experience was an anomaly. 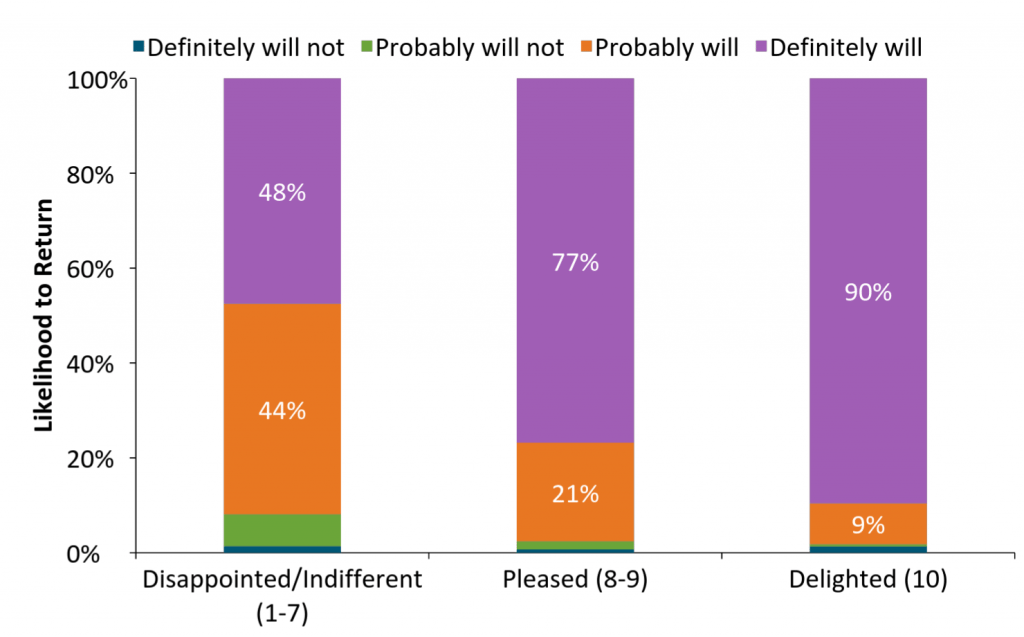
Chart 5: Many tourism bureaus still insist that word of mouth marketing is some of the most powerful marketing they have. Those who are disappointed make far fewer negative recommendations than those who are delighted make positive, according to this study. This chart shows that respondents who are delighted with their destination make up to four positive word of mouth recommendations more than those who said they were pleased. Those who said they were disappointed or indifferent made about two and one negative word of mouth comments, respectively.
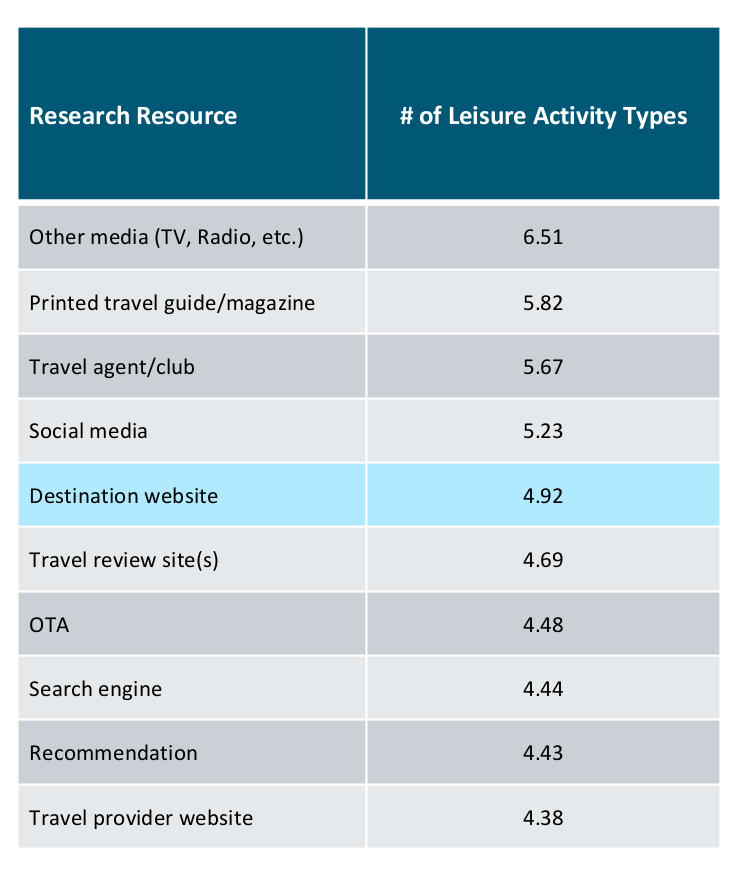
Chart 6: Respondents said, on average, they used traditional media such as TV and radio to plan 6.51 different types of leisure activities in their destination, the highest number of any trip-planning resource. Respondents said they planned more activities through researching social media than using a tourism bureau’s website, but they also said they use a tourism bureau’s website to plan more activities than are planned on a travel review site, search engine or online travel agency.
Last week Skift ranked the world’s 25 best tourism websites in 2016 to showcase which destinations do the best job at storytelling, design and effectively speaking to different consumer profiles.
Source: JD Power and Associates and Smith Travel Research
The Daily Newsletter
Our daily coverage of the global travel industry. Written by editors and analysts from across Skift’s brands.
Have a confidential tip for Skift? Get in touch
Photo credit: JD Power found 48 percent of U.S. travelers are pleased with their destination experiences. Pictured are travelers on a Segway tour in Boston. Kenneth Lu / Flickr
