Skift Take
Chinese travelers will continue to be more common in many U.S. markets during the next five years, but their numbers will not grow as fast as they have over the last decade.
By 2020, China will be the largest international source market for the U.S. excluding Canada and Mexico, a pivotal shift in the visitor pie chart that has been dominated by Japan and the U.K. for decades.
That’s according to a report from the Pacific Asia Travel Association, which analyzes international travel and tourism trends in the Asia-Pacific region. It forecasts that nearly five million Chinese travelers will visit the U.S. each year by 2020, with an annual growth rate of about 13 percent during the next five years. Last year, nearly three million Chinese travelers visited U.S. destinations, making China the third largest overseas source market.
That pegs China accounting for nearly six percent market share of all U.S. overseas visitors by 2020 compared to 4.27 percent and 4.03 percent for the UK and Japan, respectively. After Canada and Mexico, which together claim more than 50 percent market share of international visitors to the U.S., the UK and Japan have long been the dominant overseas markets. David Huether, U.S. Travel Association’s senior vice president of research, said visitation from those countries will still rise during the next decade but probably with annual growth rates only in the single digits.
Though Chinese travelers will technically be more common than other overseas markets in many U.S. destinations, travel brands shouldn’t necessarily anticipate an oncoming wave.
That’s already happened, said Huether. What’s coming next is strong growth but nothing as large as the past 10 years.
“The pace of Chinese arrivals to the U.S. is moderating,” said Huether. “In 2011 that market was growing at a rate of 36 percent and 20 percent in 2013 and 2014. If we look at the forecast, it’s still double digit growth through 2020, but it’s more in the 16, 17 or 18 percent range. But you’d expect this to happen.”
“Instead of overseas visitation to the U.S. being dominated by just a couple countries, it’s now being more equally shared by a number of countries. Right now about eight countries make up half of overseas visitation, whereas in 2000, two countries made up a huge chunk.”
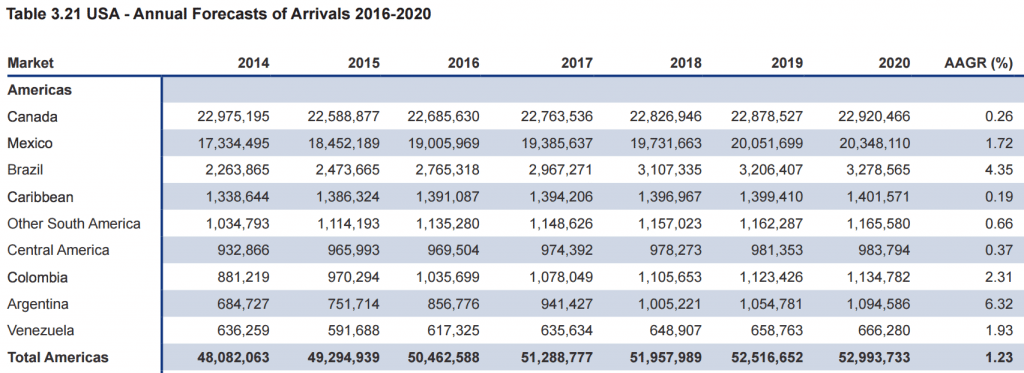
China isn’t the only market seeing growth in the U.S.–Brazil currently is and will be the third largest overseas source market in 2020. Overall visitation from Asia-Pacific, however, will have the highest average annual growth rate through 2020 as the charts below highlight.
When comparing international spending data in the U.S. for March 2016 to March 2015, the U.S. Travel Association found travel exports were up 3.5 percent overall. Last year international travelers spent $277 billion in the U.S. “That’s the best performance we’ve seen in a couple years,” said Huether. “There is some evidence that the moderation in spending from international visitors is starting to ebb.”
Source: Pacific Asia Travel Association
What’s Behind China’s Rise
Foreign currencies play a major role in international travel and how much spending takes place. Japan’s currency has slightly weakened against the U.S. Dollar in recent years and spending is slowing. In comparison, the Chinese yuan hasn’t declined as much against the Dollar, and the U.K. Pound’s slight softening against the Dollar only started within the past year, Huether said.
Higher incomes in Asia-Pacific, and particularly China, also help fuel tourism growth to the U.S., “In terms of the income elasticity, the majority of the source markets in Europe (particularly France and Germany) and the Americas (particularly Argentina, Brazil, Mexico and Venezuela) display higher levels of income sensitivity than the markets from Asia-Pacific,” the report points out.
Asia-Pacific Annual Visitation to the U.S., 2013-2019
Note: Chart doesn’t show 2020 projections, but report outlines China as largest visitor market by 2020.
European Annual Visitation to the U.S., 2014-2020
Note: First column of chart from left is 2014 and second to last column from right is 2020.
The Americas Annual Visitation to the U.S., 2014-2020
Source: Pacific Asia Travel Association
The Daily Newsletter
Our daily coverage of the global travel industry. Written by editors and analysts from across Skift’s brands.
Have a confidential tip for Skift? Get in touch
Tags: china outbound, tourism, usa
Photo credit: Chinese tourists on the Brooklyn Bridge in New York City. Vincent Desjardins / Flickr


