Skift Take
For first time Uber is now more popular among business travelers than taxis as a percent of all rides, a seminal moment if there ever was one for the business traveler transport economy.
The formerly-sharing-economy—now more accurately called the rental economy—is now in full disruption mode, not just at the edges.
Consumers have already spoken with their apps, especially for companies like Uber and Airbnb, and now the big change is coming to the hitherto relatively hidebound corporate travel sector.
Business travelers have adopted these services, especially Uber, due to the ease of use, and 2015 will go down as the year where services such as these started getting integrated with the corporate travel booking and expense tools.
One such expense company Certify, a cloud based travel and expense management software company, just released its Q2 2015 business travel expense trends, based on analyzing the habits of its users.
The data shows that Uber is very mainstream in United States now, and for the first time starting in the second quarter this year is now more popular among business travelers than taxis as a percent of all rides, a seminal moment if there ever was one for the business traveler transport economy.
While ridesharing pioneer Uber continues to gain ground against direct competitors and traditional ground transportation. The data also shows that business travelers are starting to choose Airbnb over hotels at an increasing rate, though still in early stages.
Below are eight charts that charts that growth of Uber, Lyft, and Airbnb, versus taxis, car rentals and hotels.
Chart 1: Uber is fast evolving to become the preferred choice of business travelers for ground transportation in the U.S. For the first time more road warriors are choosing Uber over taxis as a percent of all rides.
| Total Ground Transportation | Percentage |
|---|---|
| Uber | 55% |
| Taxi | 43% |
| Lyft | 1%* |
| Other Rideshare | 1% |
* 153% increase between Q1-Q2 2015.
Chart 2: The growth of Uber as a business traveler expenses transport option versus taxis, over the last year, according to Certify data.
| Month | Uber | Taxi |
|---|---|---|
| June 2015 | 55% | 43% |
| May 2015 | 52% | 46% |
| April 2015 | 53% | 46% |
| March 2015 | 47% | 52% |
| Feb. 2015 | 45% | 54% |
| Jan. 2015 | 46% | 53% |
| Dec. 2014 | 40% | 59% |
| Nov. 2014 | 40% | 59% |
| Oct. 2014 | 34% | 65% |
| Sept. 2014 | 32% | 67% |
| Aug. 2014 | 31% | 68% |
| July 2014 | 28% | 72% |
| June 2014 | 26% | 74% |
| May 2014 | 22% | 78% |
Chart 3: Uber has been in hyper growth mode.
| Uber Vs. Taxi Vs. Rental Car | Q2 2014 | Q2 2015 |
|---|---|---|
| Uber | 8% | 21% |
| Taxi | 37% | 24% |
| Rental Car | 55% | 45% |
Chart 4: Users overwhelmingly rate ridesharing services higher than taxi or rental car.
| Rideshare Vs. Rentals Vs. Taxis | Rating |
|---|---|
| Lyft | 4.86 |
| Uber | 4.59 |
| Rental Car | 3.9 |
| Taxi | 3.7 |
Chart 5: Not surprisingly, Uber is big in San Francisco and Los Angeles, where taxis were a nightmare to begin with. New York is the biggest volume market for Uber, though.
| Uber as % of Total Rides | Q1 2015 | Q2 2015 |
|---|---|---|
| San Francisco | 71% | 79% |
| Los Angeles | 56% | 60% |
| Dallas | 49% | 54% |
| Atlanta | 41% | 46% |
| Chicago | 25% | 31% |
| New York | 21% | 31% |
Chart 6: The other rideshare company Lyft is growing fast, but is in second place by a large margin. The top three cities with the greatest gains in ridesharing usage, below.
| Ridesharing Gains by Market | Chicago | Miami | San Francisco |
|---|---|---|---|
| Lyft | 800% | N/A | 63% |
| Uber | 132% | 83% | 55% |
Chart 7: On the accommodation side, after Airbnb launched its business service a year ago it has seen significant growth from Q1 to Q2 2015. On average, business travelers are also staying longer with Airbnb than they are hotels.
| Airbnb Vs. Hotels | Average Room Nights | Expense Amount |
|---|---|---|
| Airbnb* | 3.8 nights | $571.53 |
| All Hotels | 2.12 nights | $222.55 |
*143% Growth from Q1 2015 to Q2 2015
Chart 8: The most popular cities for Airbnb with average expense amounts.
| Top 5 Cities for Airbnb | Avg. Expense Amount |
|---|---|
| San Francisco | $558 |
| Chicago | $238 |
| Seattle | $221 |
| Miami | $139 |
| Tampa | $103 |
Chart 9: On average, Airbnb users rate their stay higher than those who use hotels.
| Users Love Airbnb | Rating |
|---|---|
| Airbnb | 4.72 |
| Hotels | 4.04 |
Dwell Newsletter
Get breaking news, analysis and data from the week’s most important stories about short-term rentals, vacation rentals, housing, and real estate.
Have a confidential tip for Skift? Get in touch
Tags: airbnb, lyft, sharing economy, uber
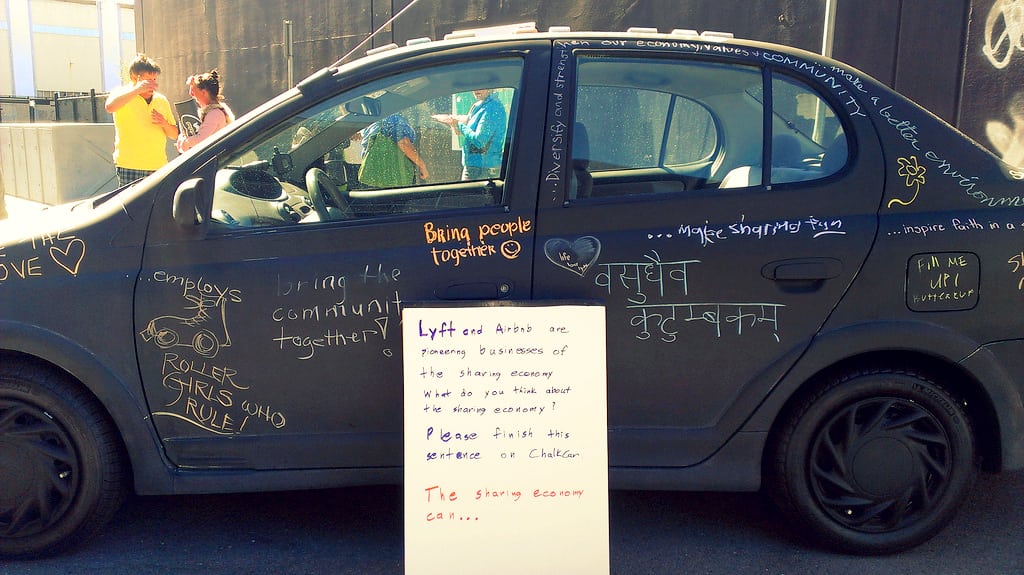
Photo credit: The sharing economy disruption is now fully enmeshed with business travel. Citymaus / Flickr
