Virgin America Reports its First Full Year of Profitability

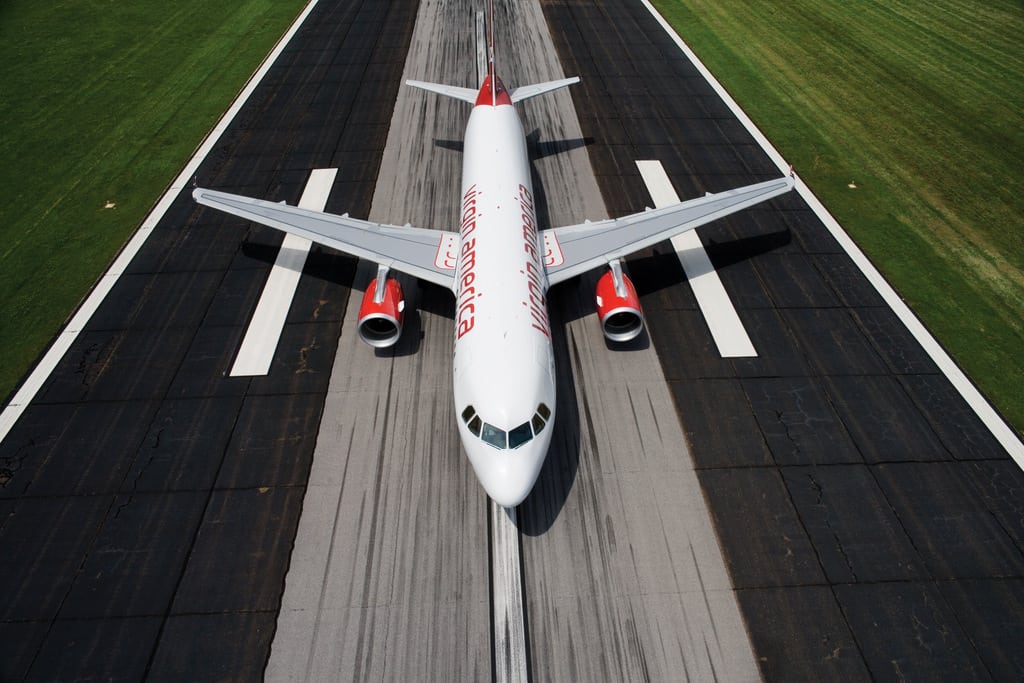
Photo Credit: Virgin America
Skift Take
Perhaps Virgin America can build on this good year and begin adding more cities to its stingy route map.
Virgin America finally has some good news.
Today the airline reported fourth quarter and full year 2013 results. Operating revenue for the full year rose 6.9% to $1.42 billion, and net income came in at $10.1 million, compared with a $145.4 million net loss in 2012. This is the airlines' first full year of profitability.
"2013 was a year of tremendous progress for Virgin America," said David Cush, Virgin America's President and Chief Executive Officer. "We continued to reach more customers in more markets and now have a network presence from San Francisco and Los Angeles to most of the primary business centers in the U.S."
The average fare in 2013 rose 4.3% to $203.70 , and revenue per seat mile climbed 8.3%. This increase was not built on the back of fees -- Virgin ranked a modest 10th place among U.S. airlines for the first nine months of 2013 -- but cost cutting and innovative on-board merchandising via in-flight entertainment systems.
"Revenue per av
