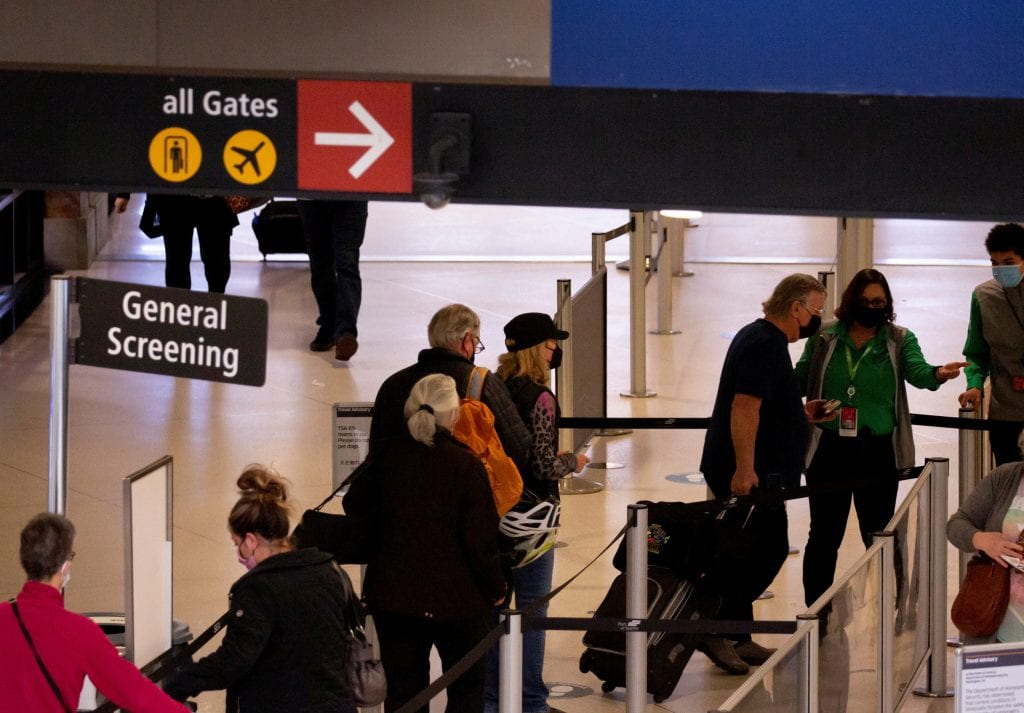
The U.S. air travel has finally recovered, at least for one holiday weekend.
Over the Labor Day holiday long weekend, the U.S. Transportation Security Administration (TSA) screened nearly 11.1 million people, or 3 percent more over the corresponding five day period in 2019, according to data released Tuesday. In fact, the TSA screened more people on four of the five days from September 1-5, marking the first sustained period of checkpoint throughput above pre-pandemic levels.
The TSA data does not necessarily mean 3 percent more people flew over the long weekend; the agency’s data also counts airport staff and some crews. But surpassing pre-pandemic screening levels is an important threshold in the broader travel industry recovery.

But while travelers are back, U.S. airlines are not. The departure of many senior staff during the crisis and subsequent hiring sprees have resulted in less experienced airline workforces that, while headline staffing numbers may be comparable to three years ago, are less productive than the employees they replaced and unable to handle the same number of passengers and flights. This trend, as well as weather and air traffic control constraints, forced a spike in flight delays and cancellations early in the summer. Airlines remain cautious about over extending their resources and are keeping schedules in check despite strong travel demand; U.S. domestic seat capacity remains about 4 percent below 2019 in September, according to Diio by Cirium.
But the optimism is palpable in the airline industry. With demand broadly outstripping supply, fares are up, which is good for airlines’ bottom lines. And the recent decline in oil prices after a dramatic run up earlier this year means the industry can keep more of those record revenues in the bank.
TSA Screening Volume 2019-2022
| Date | 2022 | 2021 | 2020 | 2019 |
|---|---|---|---|---|
| 9/5/2022 | 2,398,857 | 2,025,556 | 935,308 | 2,292,985 |
| 9/4/2022 | 1,979,906 | 1,630,786 | 689,630 | 2,370,003 |
| 9/3/2022 | 1,903,791 | 1,545,955 | 664,640 | 1,755,502 |
| 9/2/2022 | 2,479,329 | 2,129,999 | 968,673 | 2,198,828 |
| 9/1/2022 | 2,312,486 | 1,896,846 | 877,698 | 2,109,858 |
| 8/31/2022 | 1,989,119 | 1,465,197 | 578,131 | 1,889,044 |
| 8/30/2022 | 1,758,344 | 1,345,064 | 516,068 | 2,037,750 |
Tags: tsa