How To Analyze And Manage Facebook Ad Campaigns

Launching a Facebook campaign doesn’t end when you create your ads and display them online! That’s just the start! Why bother investing in an ad campaign if you cannot measure its effectiveness, quality and scope? It’s important to test different ad images and texts, modify your budget, or even stop current ads if they are not performing well. While you cannot completely control the results of your campaigns, you can nevertheless control how your campaign is carried out. You can duplicate, change or delete ads whenever you want to.
The success of any ad campaign is partly based on how you manage your ads and how well you understand your target audiences. By carrying out tests on your ads prior to launching your full-blown campaign, you will soon gain insight into what works (and what doesn’t!). You’ll notice some ads will generate more actions or reactions than others.
Changing your ad campaigns
Thanks to Facebook’s Ads Manager, you can analyze the results of your current campaign and make minor or major changes to it. Any modifications you make take about 15 minutes to come into effect.
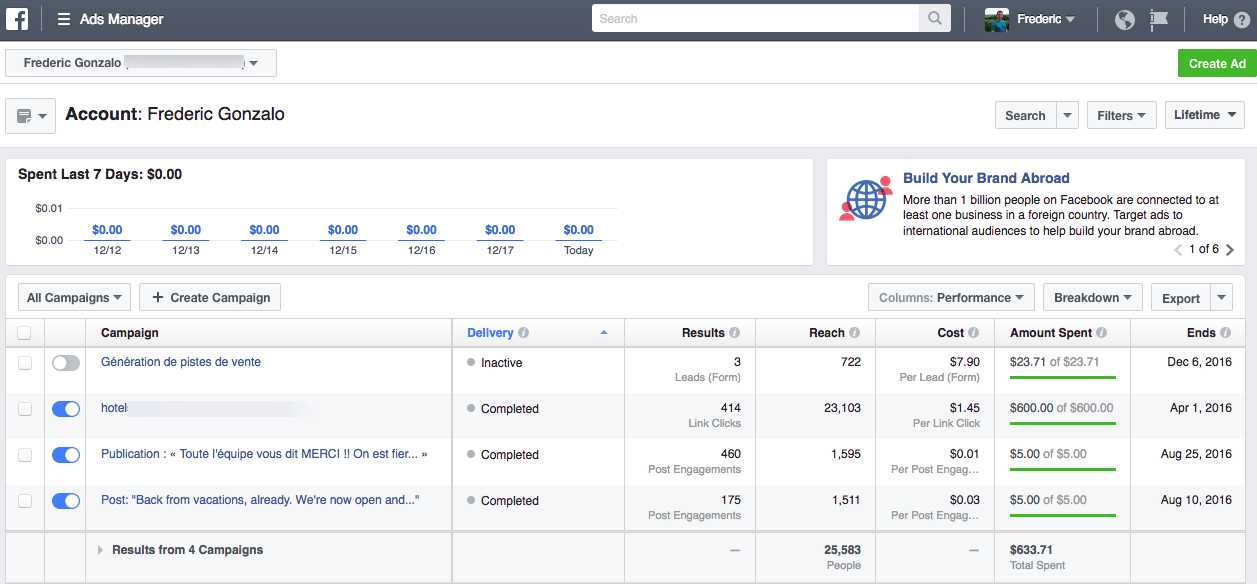
It’s very easy to modify a campaign, ad sets or one ad. All you have to do is select the item(s) you want to change. Click on Edit. You can also display, turn on, turn off or delete a campaign. You can also create a similar campaign.
Customizing the information that is displayed
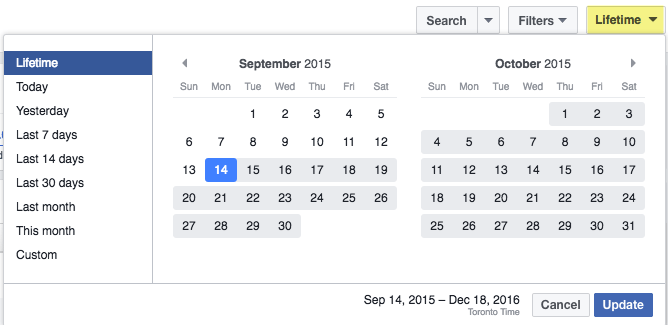
Don’t forget that if you want to view the results of past campaigns that were running over a month ago, you must change the display dates in the Ads Manager. Click on the Lifetime button and select the period you want. You can also simply click on the Lifetime button to view all of your campaigns.
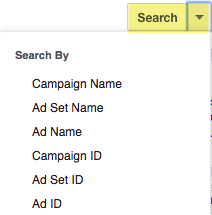
You can also perform a search by campaign name, ad set name, ad name, campaign ID, ad set ID or ad ID.
There are also several ways you can filter the information that is displayed: by delivery, objective, billing event, optimization goal, placement, metrics and date updated. In a nutshell, you have a wealth of data you can analyze!
Define your KPIs
Before analyzing the performance of your ads and creating ad reports, you should first determine your campaign’s KPIs. When you first defined your marketing objective at the start of your campaign, you probably already had one or several KPIs in mind, such as interactions, Page Likes, or clicks to your website.
What other metrics do you deem important to analyze for your brand? Do you want to measure the number of interactions, engagement rates, cost per interaction, the cost by action, the number of Likes your page receives, the number of impressions or your ad’s reach?
Facebook allows you to access many different types of KPIs to better understand your campaign’s performance. At this stage, you should define what KPIs you want to analyze. It will go a long way into more accurately depicting your target audiences and creating new campaigns that will generate more results—at a lower cost. Read this article to learn more about what KPIs you should measure.
Viewing your ad KPIs
When you create an ad campaign in Facebook’s Ads Manager, you have real-time access to data on how it is performing. The data can be displayed in a table or graphical format so as to easily visualize your campaign’s progress.
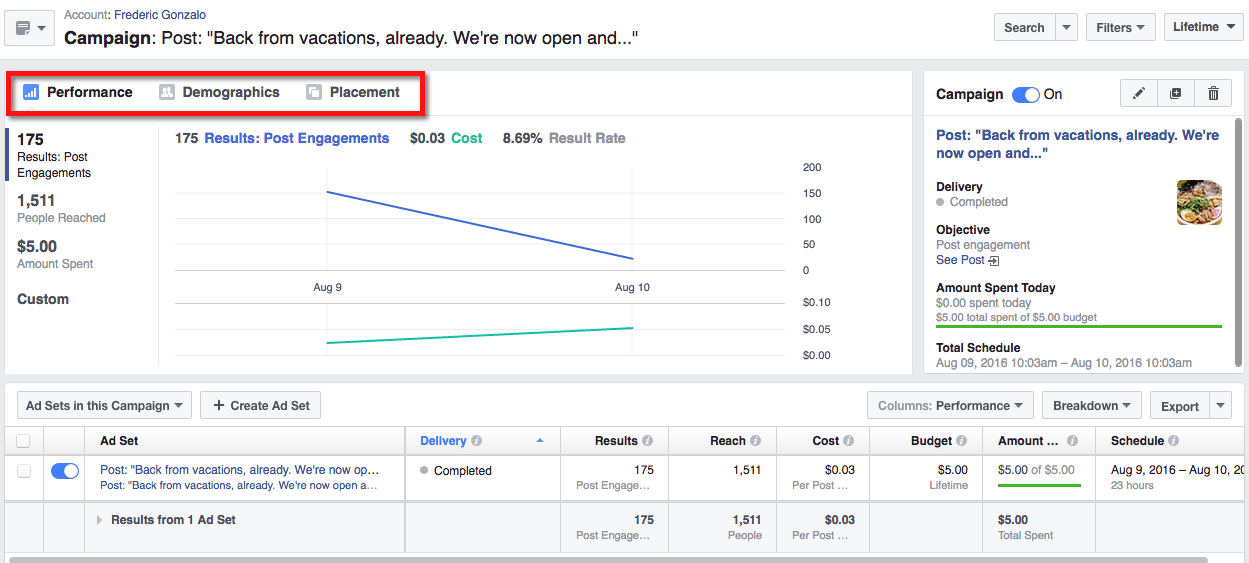
After you click on a specific campaign, a summary graphic of its performance will be displayed at the top of the page. You can also view graphics based on the campaign’s demographic and placement performance.
Customizing results display of your campaigns
By default, the results of your campaign will be displayed to analyze its performance (Columns: Performance, located right above your campaign table). However, you can change the display based on your needs. You can choose between delivery, interactions, engagement, video engagement, etc.), which hone in on specific campaign parameters.
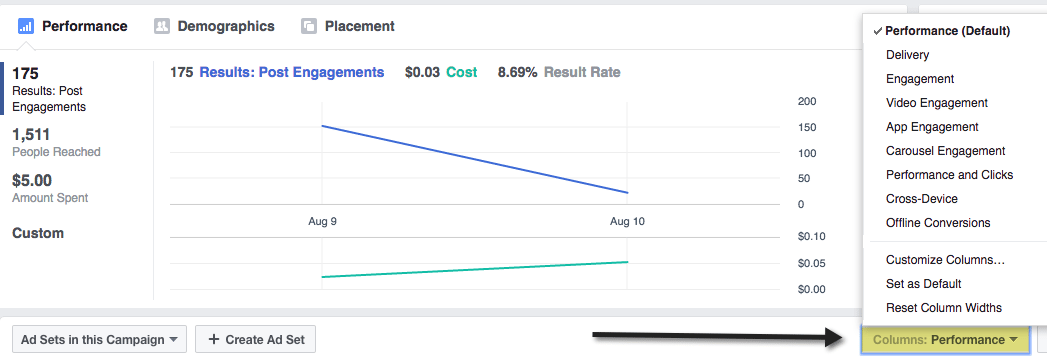
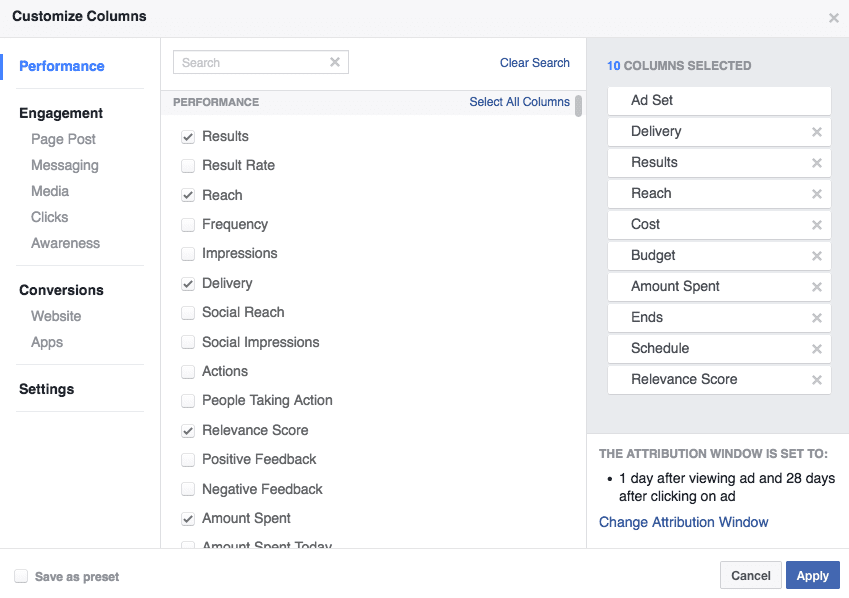
You can also click on Customize Columns…, which will give you more options on all the data you can analyze.
In addition to changing how the results table is displayed, you can also customize the data in it, adding such metrics as age, gender, country, and much more. Simply click on the Breakdown button and make your selections. The columns of your table will remain the same; however, the rows will be split by what breakdown parameter you selected, such as the age groups that interacted with your brand or the costs per action based on gender. You’ll be able to come to many different conclusions by analyzing different metrics.
Understanding your relevance score

What is a relevance score? It is a metric determined by Facebook that evaluates the relevance of an ad for its target audience based on the ad’s performance. The higher your Relevance Score is, the more likely that your ad will be delivered to your target audience—and the less you’ll pay to reach these people. The score ranges from 1 to 10 and depends on many factors, including positive and negative reactions to your ad. The relevance score should be kept in mind to find ways to decrease your ad cost and improve your ad’s overall performance.
Exporting data
If you want to export your ad data in order to compile results, create different tables and graphics, or simply save your ad data for your brand, you can export data (the report) in .xls or .csv format.
Saving and scheduling reports
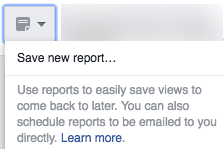
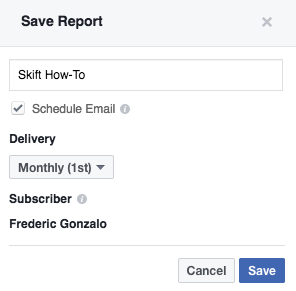
If you prefer created an ad report based on the columns and customized results you have set, all you have to do is save your report. You can save up to 10 reports for each Facebook ad account. You can also schedule up-to-date reports to be emailed to you on a daily, weekly or monthly basis.
This is a quick overview of some of the many features you can find in Facebook Ads Manager. As you can see, there are dozens of ways to better understand your ad campaign’s performance and target audience’s behaviour. This is why it is so important to test different ads and ad formats. Don’t simply create an ad or two and let them be displayed without carefully monitoring their performance. Again, you can change your ads at any time to increase their performance levels. Take advantage of this tool and manage your ads on a daily basis. You’ll soon notice the results!


