5 Charts Showing How Travelers Pay for In-Trip Transactions
Skift Take
Travelers are the perfect targets for pickpockets and other kinds of credit card fraud as they spend and swipe in places where they are not always sure what trusted card readers or payment technologies look like.
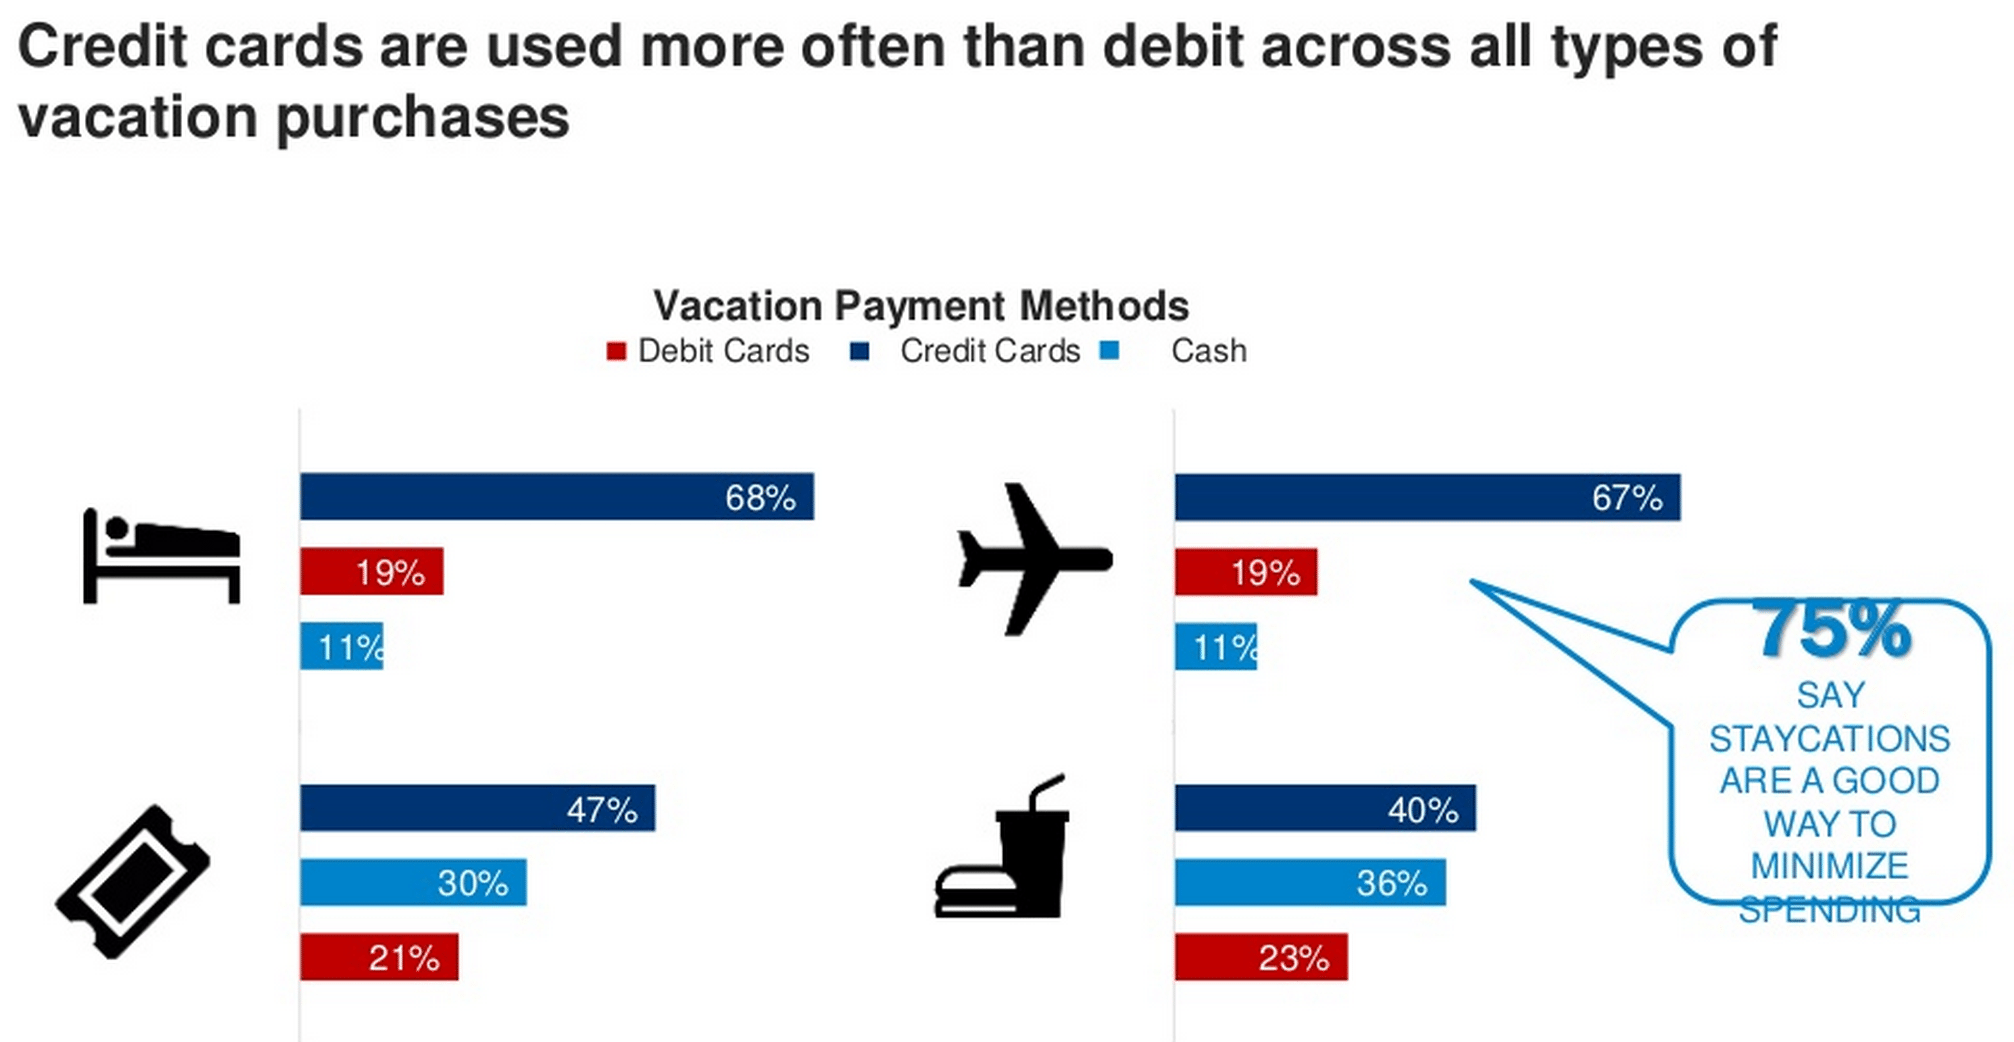
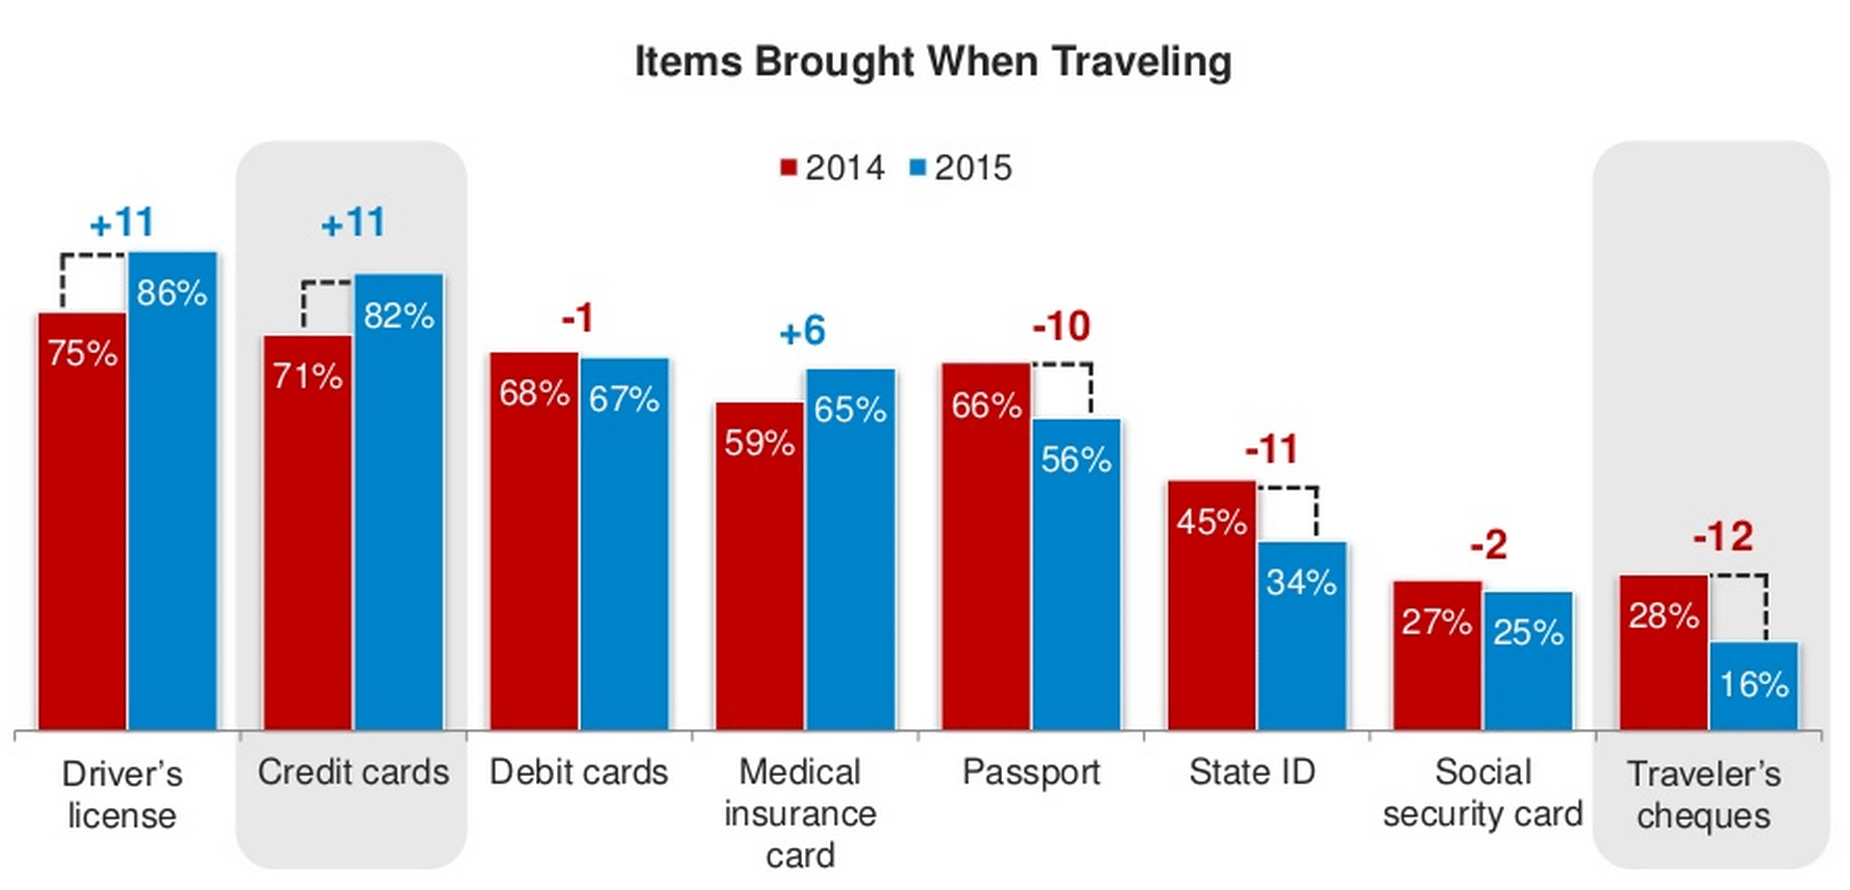
Experian ran a study this past summer and found that credit cards are on a sharp incline in terms of U.S. travelers bringing them on their trips while bringing along debit cards has dipped slightly since 2014. During a trip, the gap is smaller between paying with credit cards and cash for things like attraction entrance costs and food and beverage purchases. The study included 1000 U.S. adults aged 18 and older who expressed interest in travel.
Separate from the study, Americans received more than $4 million in vacation loans since last year from Prosper, a peer-to-peer lending platform that lets travelers apply for personal vacation loans (this number is likely higher when considering other vacation loan providers).
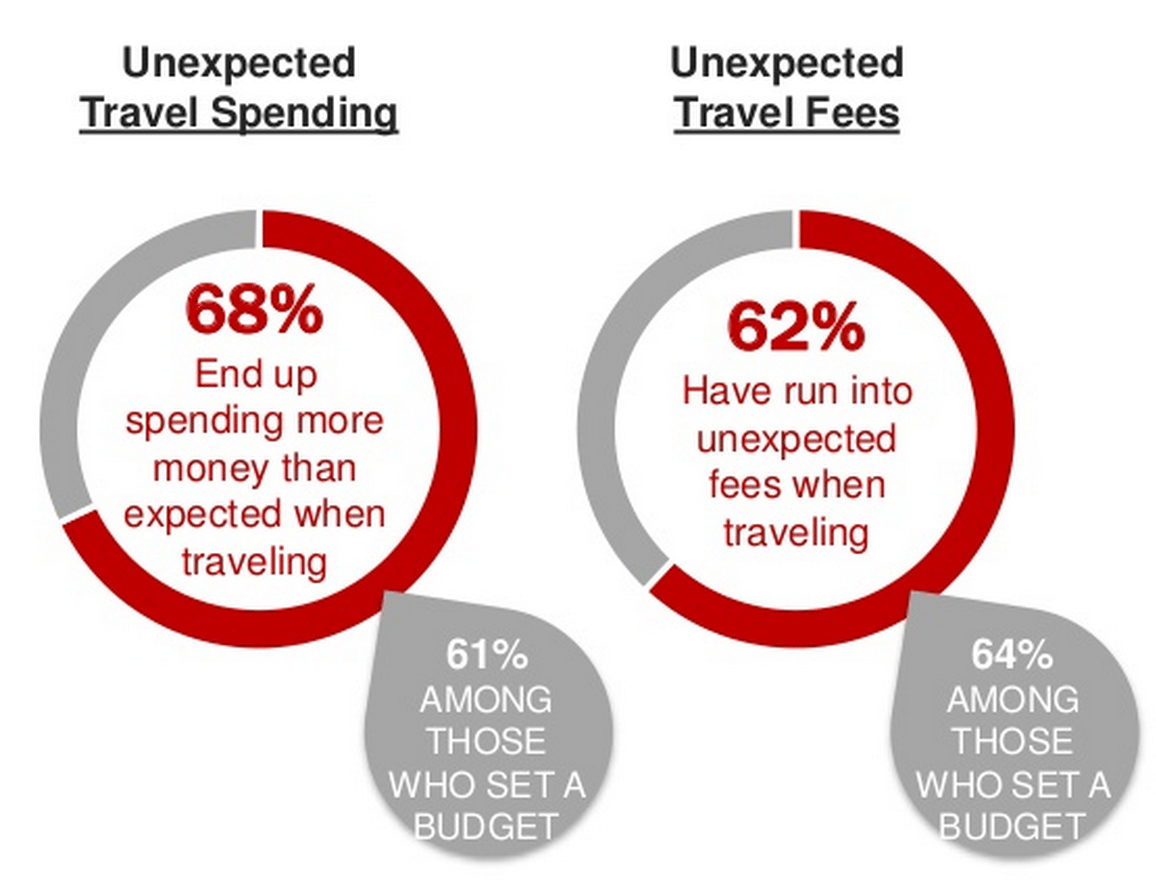
Chart 1: More than half of U.S. travelers end up spending more than expected or run into fees they didn’t plan for during their travels.
Source: Experian
Chart 2: Propser has issued more than $4 million in vacation loans to U.S. travelers since 2014. The states where travelers have applied for the most loans are also some of the country’s most visited such as New York, California and Florida.
| Rank | State | Loan Volume |
|---|---|---|
| 1 | California | $2.09 million |
| 2 | New York | $1.2 million |
| 3 | Texas | $1.03 million |
| 4 | Florida | $568K |
| 5 | New Jersey | $442K |
| 6 | Illinois | $377K |
| 7 | Michigan | $299K |
| 8 | Virginia | $274K |
| 9 | Ohio | $170K |
| 10 | Georgia | 156K |
Source: Prosper
Chart 3: Credit cards are used overwhelming more than debit cards or cash when paying for accommodations or airfare, but the gap is smaller for food and attraction costs.
Source: Experian
Chart 4: Some 11% more travelers brought credit cards and driver’s licenses with them so far during 2015 than last year. Documents such as passports and traveler’s cheques saw double digit decreases year-over-year in terms of how many travelers brought them along. Note- this chart looks at a question asking U.S. travelers what they bring on both domestic and international trips.
Source: Experian
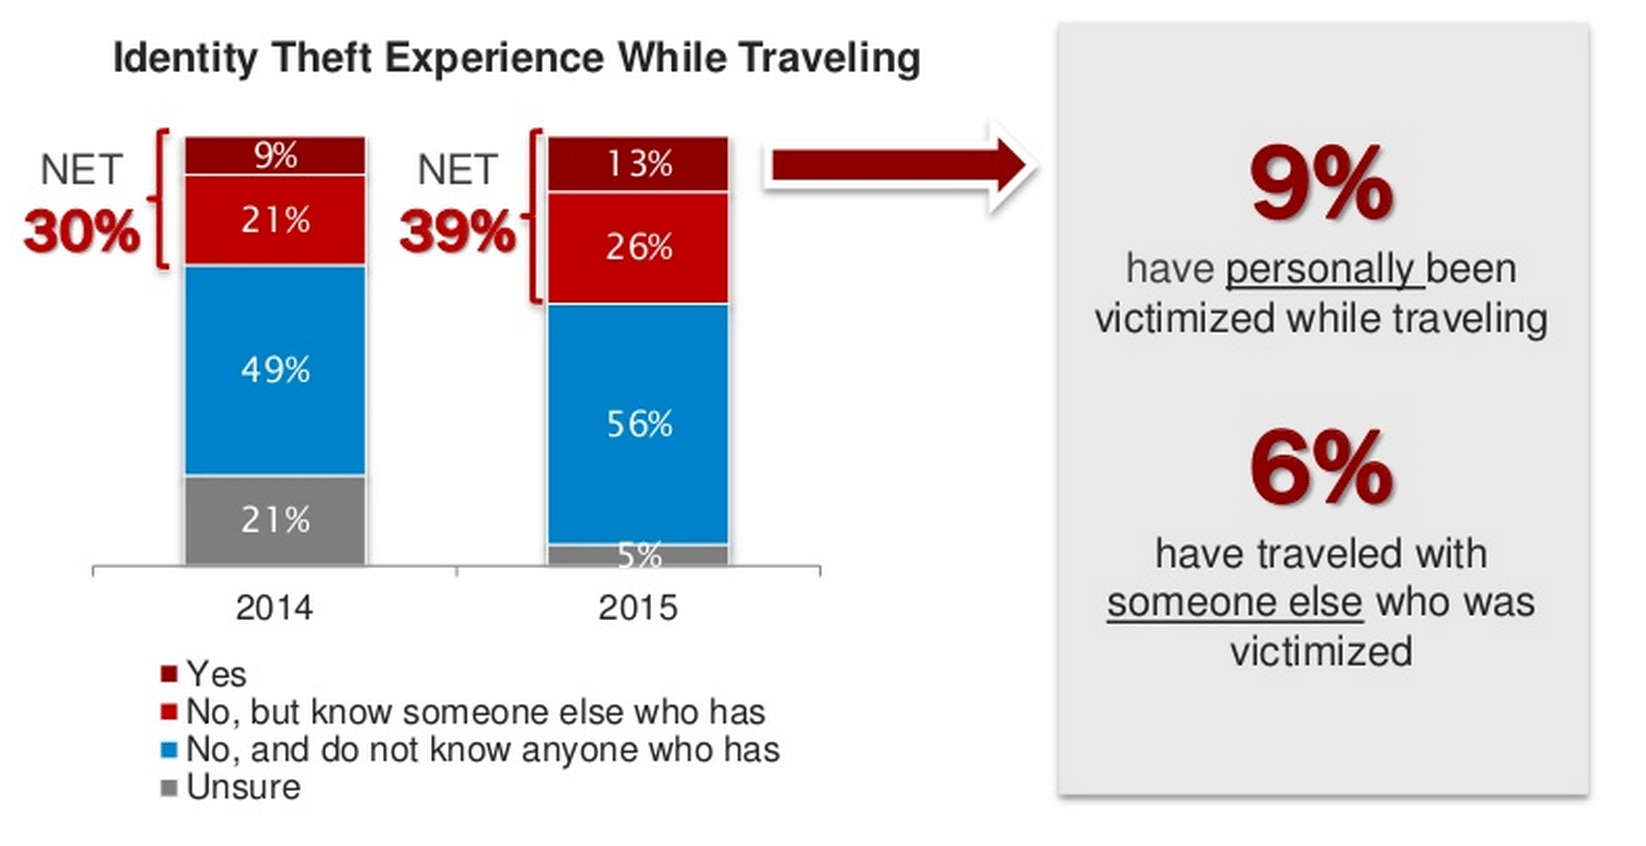
Chart 5: Far more travelers haven’t experienced any identify fraud than those who have, but about one in ten travelers still report experiencing some type of identity fraud while vacationing.
Source: Experian
