Skift Travel 200: The Definitive Way to Track Travel Stocks

Skift Take
The S&P 500 index quickly captures the stock price performance of some of America's largest companies. The Nasdaq tells us how the tech sector is doing. But – until now – there has been no index for the travel industry.
Introducing the Skift Travel 200: the travel industry in one number.
The Skift Travel 200 stock index will be the first benchmark to measure the $1 trillion-plus market for public travel companies. It tracks travel company stock performance, as well as key metrics, including revenue growth and profit margins.
Skift has long pushed to break down the walls between sectors within travel through its reporting, events, and research. But standard breakdowns do not recognize travel as an independent industry.
The global industry classification isn't helpful. Airlines are a sub-sector under “Industrials.” Hotel brands fall under “Consumer Discretionary,” but hotel owners often end up as “Real Estate.” Online travel agencies fall into the “Information Technology” industry.
How are travel stocks doing? It's been tough to say.
Skift's Travel 200 stock index solves this by creating an “S&P 500 of travel.” The index provides a single number that represents the performance of the global universe of public companies. For now, it tracks 196 public companies from 34 countries divided into five regions. Each company is classified into one of five travel sectors and 14 sub-sectors. As travel companies IPO, we'll add them to the index, but aim to keep it at 200 members.
In this launch post, we highlight several index use cases like stock price performance, comparisons against other benchmarks, sector breakdowns, and fundamental industry data.
If you're a Skift Research subscriber, you will have full access to the Skift Travel 200 as part of your subscription. Non-subscribers can choose their plan on our subscription page.
Travel Industry Stock Performance
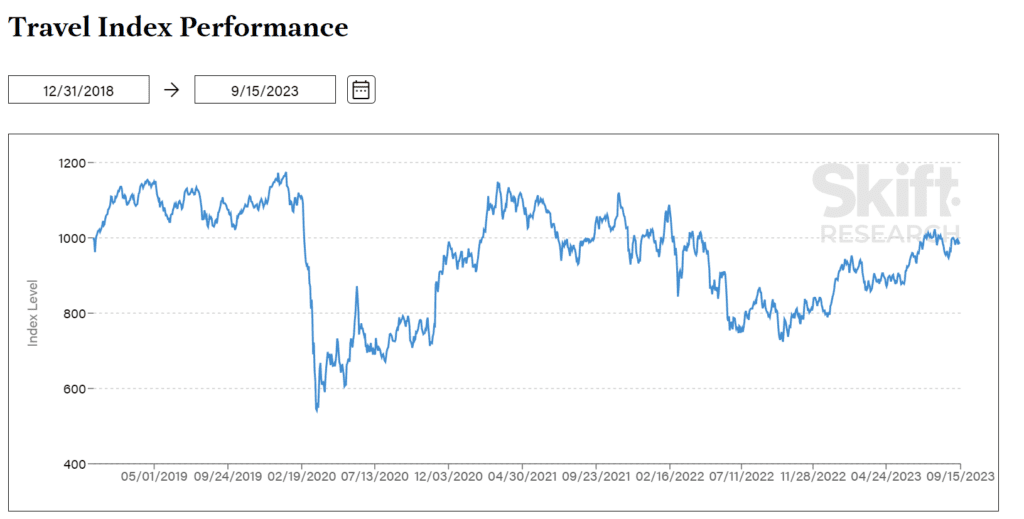
Where does the travel industry stand today? The Skift Travel 200 sits at 985 as of September 15, 2023. That’s down slightly from the index’s starting value of 1,000 on December 31, 2018.

The historical data clearly shows the massive pandemic drop when travel stocks fell 50%+ in 2020. The industry performed well in early-2021 and had mostly recovered before drifting back downwards into 2022.
As a result of COVID, travel stocks have underperformed other important benchmarks like the S&P 500, which tracks the U.S., and the MSCI All Country Work Index, which tracks global equities. But this masks the recent trend as the travel industry has roared back to life, outperforming broad U.S. stocks by 8% over the past 12 months.

Travel’s Sector Breakdown
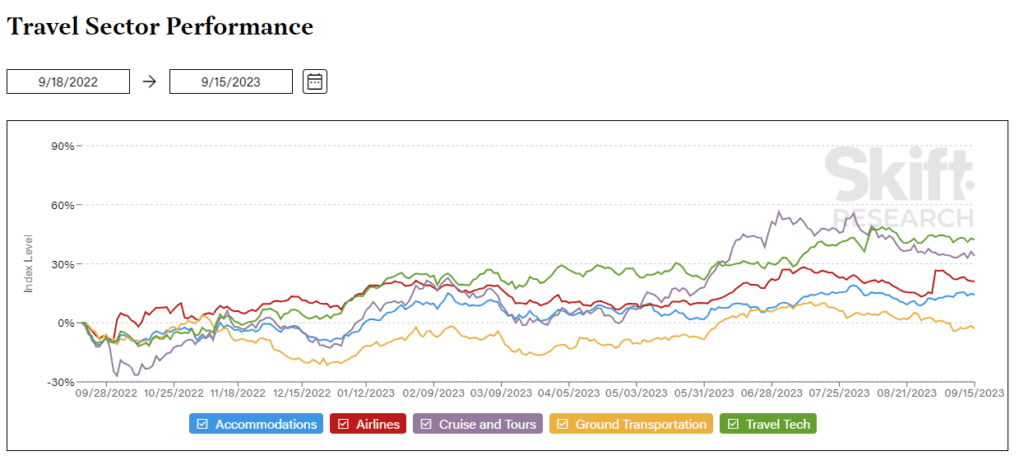
Another feature of the Skift Travel 200 is the ability to break down travel industry performance by sector. We track five sectors: Accommodations, Airlines, Travel Tech, Cruise and Tours, and Ground Transportation.

Our data shows that Travel Tech has been the best performing travel sector over the past year, up 42%, more than double the returns of the broader industry. The Cruise and Tours sector, while small, has also seen large gains this year. Cruise lines and tour operators were some of the slowest businesses to bounce back from the pandemic but are now seeing strong double-digit revenue growth rates and corresponding stock price rises.
On the other hand, ground transportation, which outperformed during the pandemic, has underperformed over the past year. Airlines have performed about in line with the broader sector while Accommodations have slightly lagged.
Travel Fundamental Revenue and Profit Data
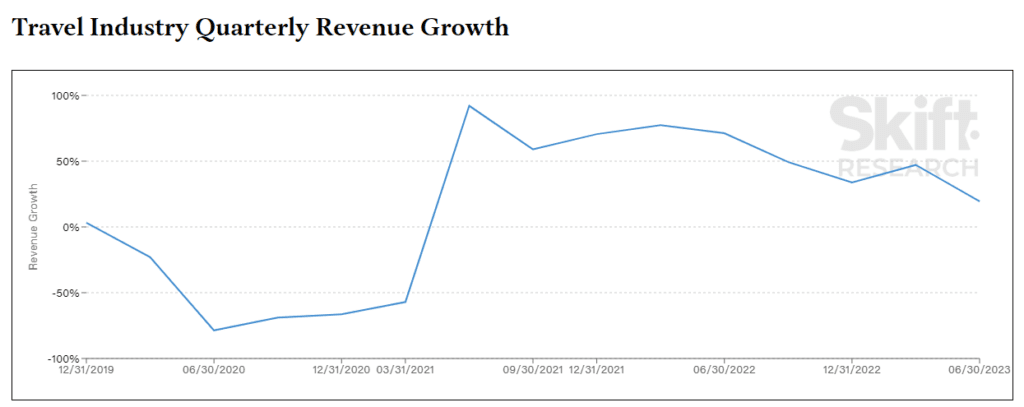
In addition to stock price data, we can use the Skift Travel 200 to analyze fundamental data about the travel industry. According to our analysis, public travel company revenues grew by 19% in Q2 2023. That’s a healthy growth rate but a big drop from the 47% top-line growth that the industry experiences in Q1.

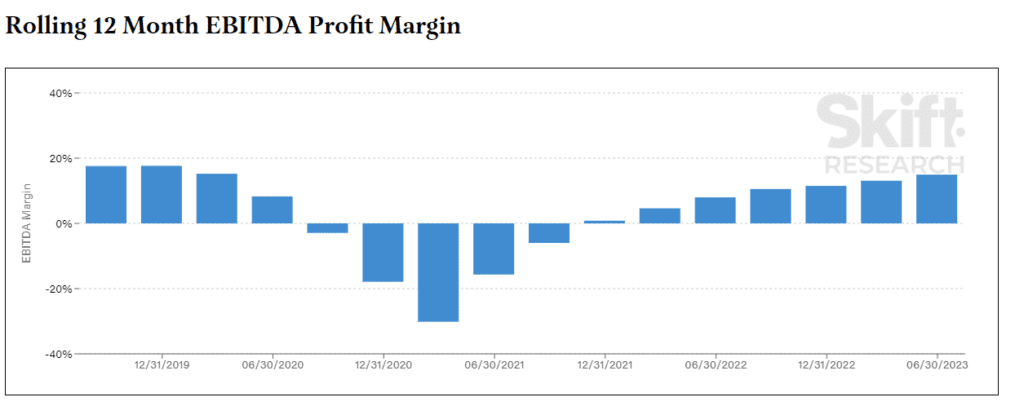
This is part of an ongoing normalization of travel industry performance. Industry performance saw massive growth as it snapped back from the 50%+ declines of the pandemic. Similarly, profit margins, as measured by earnings before interest, taxes, depreciation, and amortization (EBITDA), fell to -30% at the worst of the pandemic. Today, margins have recovered to 15%, nearly in-line with the 18% margin the industry earned in 2019.

These are just some of the analyses that the Skift Travel 200 enables. Our full data platform allows users to drill down into sectors and sub-sectors with similar stock and fundamental data views.


