The Transformation of Skift Research

Skift Take
Let's take a closer look at how Skift Research data and analysis has transformed over the last 10 years.
Skift Research has always been a must-have staple every business in the travel industry can benefit from, backed by a team of analysts and researchers constantly on the hunt for the next biggest trends.
As we reflect on the last 10 years of Skift, it’s fascinating to see how our research has transformed. Our historical library has insights on everything from branding strategies for hotel owners to the new era of food tourism. We believe every cornerstone of travel has been touched by one of our analysts in some way, and we look forward to sharing those findings with you every month.
With that in mind, we want to take you on a journey through the evolution of Skift Research. We hand-picked some of our most seminal reports to give you a taste of how much our research has grown with the travel industry over the years.
Each report shows you how these trends have taken shape and defined the industry as we know it today.
Let’s dive in.
2013: Skift Global Trends Report: The Rise of the Chinese Independent Traveler
In our launch report “Rise of the Chinese Independent Traveler,” Skift has put together the most definitive report covering what the next generation of Chinese travelers want from their experience.
Mainland China is now the world’s largest source of foreign tourists, as well as the world’s biggest spenders on hotels and retail while they travel.
And despite slowing economic growth at home, the trend continues unabated. In the first five months of 2013, nearly 40 million Chinese traveled abroad, a double-digit increase over 2012’s already record numbers.
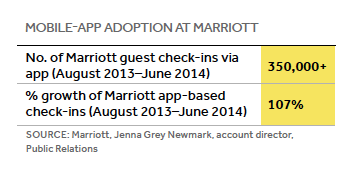
2014: The Rise of the Silent Traveler: Reaching Out to the Mobile-First Travel Consumer
The implications of an increasingly independent, mobile-equipped consumer are far-reaching for every vertical in the travel industry. Even as airlines, hotels, and in-destination attractions and offerings continue to rely upon meaningful interactions with their customer, a significant segment of travelers are turning first, in new and powerful ways, to their devices to solve trip-related challenges that have historically been resolved by in-person experiences.
Once the traveler is on the ground, at their destination, and out and about, they continue making choices. For brands, giving the self-reliant customer something they want is deeply tied to the notion of accelerating and empowering the choices they make. Finding a way into that decision-making process is key to capturing the consumer’s business.
If there’s an illustrative space where mobile can further expand the silent traveler’s experience, it might well be the realm of discovery-oriented resources. The number of consumers who’ve turned to their devices to locate in-destination options has nearly doubled in recent years.
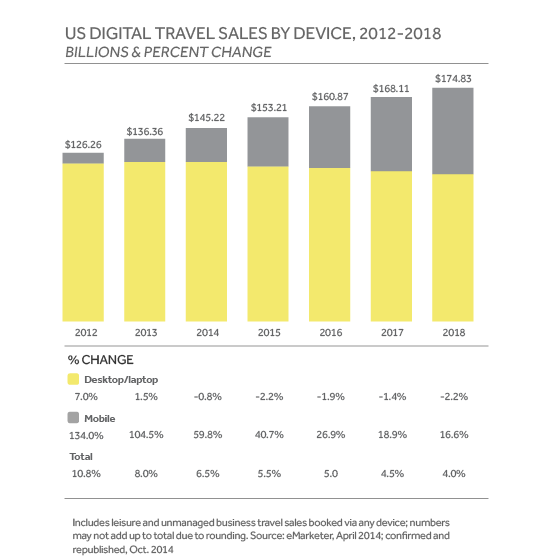
2015: The State of Mobile Booking 2015
How do top executives and mobile gurus in travel view the dramatic shift toward mobile that’s under way and what does it mean for lookers, bookers and the bottom line? This Skift Trends Report traces some of the seminal shifts of 2014, from the dramatic rise in mobile bookings to same-day hotel-booking trends and marketing trends that impact mobile development.
In the U.S., although the desktop is far from a legacy platform and still dominates travel bookings, eMarketer forecasts6 that desktop travel sales for leisure and unmanaged business travel will dip 0.8% to $119 billion in 2014, the first such decline since 2009. While the reduction in U.S. travel bookings on desktops is relatively small, the trends are clear. Mobile travel sales in the U.S. are forecast to jump 60% in 2014 to $26.14 billion.
2016: A Deep Dive Into TripAdvisor’s Competitive Position In Travel 2016
This report takes a deeper dive into the factors influencing TripAdvisor’s competitive positioning against other online travel booking sites. If travel is the industry that touches all other industries, TripAdvisor is the brand that touches all other travel brands – both consumer and enterprise facing. Despite monetization challenges, TripAdvisor’s wide footprint within the online travel ecosystem makes the company worth paying close attention to; its uncertain future could prove pivotal in the delicate balance of power playing out between online travel brands.
Pound for pound, no other online booking brand controls as much industry press attention as TripAdvisor. Analysts and pundits have scrutinized the company’s performance with a microscope, ever since user traffic began flooding away from desktop and into the mobile environment. Despite the company’s relatively small revenue base, TripAdvisor is a special case study in travel.

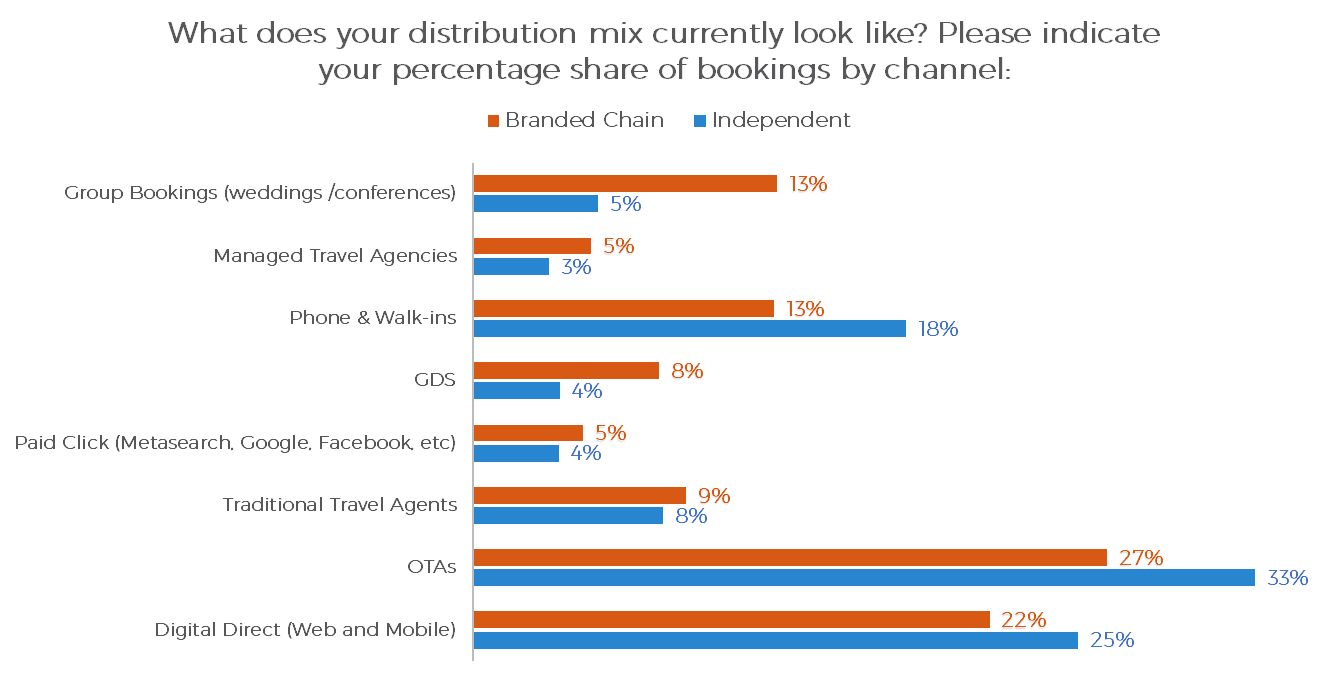
2017: 2017 Outlook on Hotel Direct Booking
We analyze distribution trends for the hotel industry by combining our own primary research and survey data from 375 hotel respondents with insights from leading hotels, online travel companies, and industry experts. These engaging interviews amount to a roundtable discussion from thought leaders in the hospitality industry.
The current distribution mix of respondents varied significantly when comparing independent hotels to hotels part of branded chains. Branded chain hotels were much more reliant on group bookings and bookings coming through GDS, on the other hand independent hotels had a higher share coming from OTAs and overall also stated a higher digital direct booking rate.
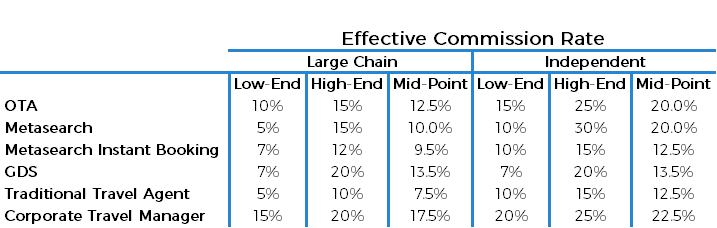
In the chart below, we show our estimates for effective commission rates across key distribution channels.
2018: A Deep Dive Into Operating and Branding Strategies for Hotel Owners
Brands are consolidating, consumer preferences are changing, disruptors are impacting the distribution landscape, and technology is evolving. Hotel owners face an increasingly complex environment in which they must choose the single, best operating model and brand strategy for a given property.
In this report, we go over, in great detail, various changes currently happening in the hotel industry and implications for hotel owners. This includes issues such as the major brands going asset light and potentially moving further away from the day-to-day operations and how that may give non-branded operators and smaller brand franchises the opportunity to flourish. We discuss how independents are likely to succeed when catering to experiential-minded consumers with a key focus on technology and using data intelligently to enhance the guest experience. We highlight key items to think about when choosing a brand. We provide our expectations for soft brands, changes in management and franchise contracts, distribution costs, and how these changes will impact hotel owners.
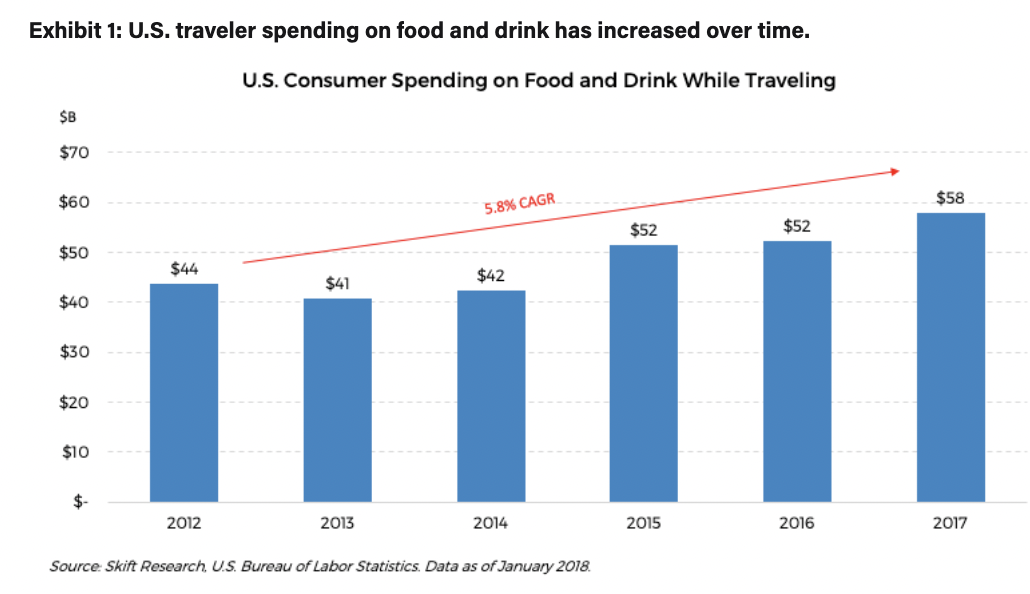
2019: The New Era of Food Tourism: Trends and Best Practices for Stakeholders
Over the past few years, food tourism has been a buzzy trend in the travel industry. Despite the buzz, the conversation around food tourism has hardly changed since it first started to spread years ago. Not to mention, there is still some confusion about what food tourism really is and how destinations and other stakeholders can get involved.
Our estimates show that U.S. travelers spent $58 billion on food and drink while traveling in 2017 (the last year for which data was available at the time of writing). This represents a 5.8% compound annual growth rate from 2012.
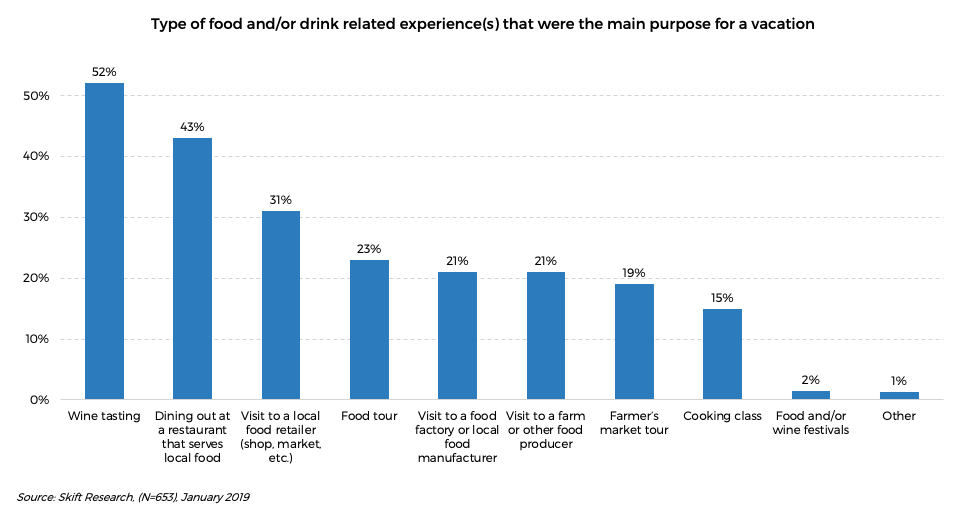
When looking at the specific types of experiences of travelers who planned their trips around food/drink related experience, wine tasting claims the first spot, with 52% of respondents saying they’ve gone on trips with that activity as the main purpose.
2020: The Hotel Property Management Systems Landscape 2020
The start of a new decade always comes with a collective expectation that the upcoming decade is going to be very different from the one left behind. In many ways this will be the case, but the track record of hotel technology is one of slow progress rather than radical innovation. There is no hotel technology solution that illustrates this better than the property management system (PMS).
The PMS is the most integral piece of tech any hotelier uses. It is vital to the efficient operation of hotels, but this importance has meant that a few major players have been able to dictate the direction of the sector.
Talk to any PMS vendor, and eventually they will pull out a diagram of their positioning in the hotel stack. Unsurprisingly, the PMS is always at the center of a hub-and-spoke style visualization. Skift Research, as well, has visualized the hotel tech stack in a similar fashion in previous reports.

For most hotel operators, this is an accurate visualization of their tech stack. Small hotels might only have a PMS system for all their requirements, while larger and more full-service properties are likely to have additional systems like a customer relationship management (CRM) system, a central reservations system (CRS), a revenue management system (RMS), a channel manager, or sales and catering system amongst others. Beyond these largely distribution-oriented tech systems there is also a growing range of “service-tech” available, like guest-facing technologies and staff-enabling systems which all engage and interact with the PMS.
2021: Sustainability in Travel 2021: Emissions Benchmark of Six Global Hotel Companies
Environmental criteria are becoming increasingly important to investors, employees, and guests. As a result, most large hotel companies report on their emissions and targets in filings to the CDP (formerly known as the Carbon Disclosure Project, a non-profit organization that encourages companies to disclose their environmental impact). We have used these filings to benchmark the current performance of six of the largest hotel companies.
This is not as straightforward as it may sound, due to the differences in capturing and reporting emissions information, as well as the different portfolios run by each company. This report sets out the main barriers to cross-comparing performances, and offers some ways to get around this.
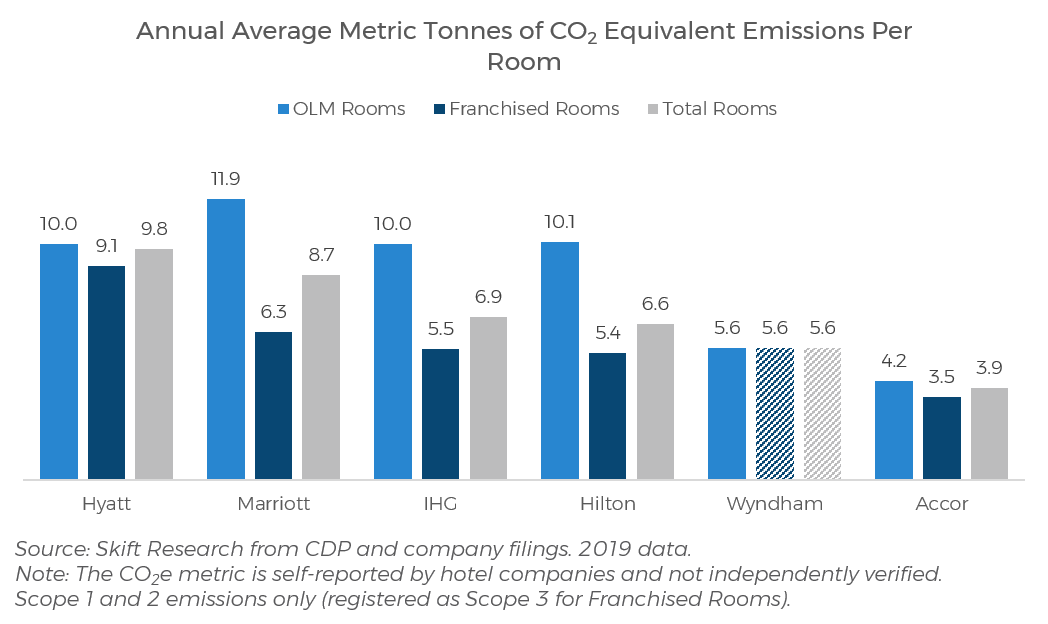
In the CDP reports, hotel companies provide total Scope 1 and 2 emissions, which relate to the OLM rooms, and Scope 1 and 2 emissions for franchised hotels, registered as Scope 3 emissions. Using this data together with room portfolio data, we can calculate the average emissions per room.
Here again is a wide spread in the environmental performance of the different companies, with Marriott registering the highest CO2e emissions per OLM room, and Hyatt the highest emissions per franchised room. Hyatt has the highest emissions per room overall.
In comparison, at almost two-thirds less emissions compared to the highest emitters, Accor is a strong performer in both OLM and franchised room emissions. Wyndham does not provide data for franchised hotel emissions.
2022: A Deep Dive Into Google’s Impact on Travel 2022
Travel is roaring back. And with the return of business also comes with it an old set of challenges. “What’s our Google strategy” is once again a key question that every travel executive needs to be asking.
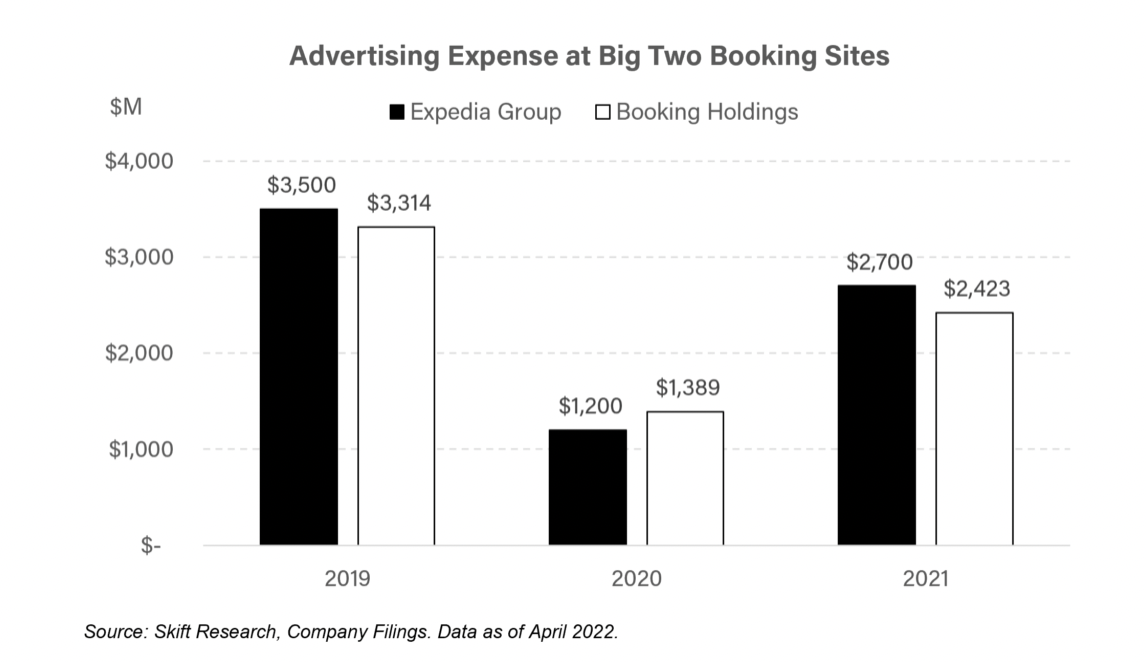
During the pandemic we have seen Expedia, Booking, and others cut their marketing spend to near nil. COVID-19 was a once-in-a-lifetime opportunity for a hard reset of Google advertising spend. OTA execs could build back up their marketing budgets in new and unique ways that reset their relationship with Google in a more productive way.
So, has that happened? Simply put: No.
Instead, with the rapid recovery of travel over the last six months, the floodgates of advertising spend have been thrown wide open again. We estimate that Expedia and Booking spent a combined $5 billion on advertising in 2021, up 98% vs. 2020 and 75% recovered vs. 2019.
Want exclusive access to data and analysis like this? Subscribe to Skift Research. An annual subscription to Skift Research provides you with 3-4 new reports every month and access to our historical library.