International Visitors Spent a Record $222 Billion in the U.S. Last Year

Skift Take
The United States received a record $222.3 billion boost to the national economy from international visitors in 2014, the National Travel and Tourism Office reported this week. This is a 4 percent increase over the $214.8 billion reported for 2013.
Americans spent an estimated $146.7 billion abroad last year creating a $75.7 billion travel-trade surplus.
Travel and tourism exports include money spent by international visitors while in the country and what they spent to get here for business and personal reasons. Goods and services include food, lodging, recreation, entertainment and local transportation.
In December alone, international visitors spent more than $18.8 billion on travel and activities to and within the United States, a 2 percent increase over December 2013.
Although spending on tourism-related activities and fares remained relatively unchanged in comparison to the year earlier, expenditures for educational and health-related tourism increased 7 percent.
The NTTO edited its definition of travel in 2009 to include business-related, education-related, and health-related travel for the first time, bringing its measurements in line with common international practices.
The following charts compare travel and tourism imports (international visitor spending in the U.S.) and exports (Americans spending abroad) for 2013 and 2014:
| Exports (Receipts) | Jan-Dec 2013 | Jan-Dec 2014 | YTD Change |
|---|---|---|---|
| Total Travel and Tourism-Related Exports | $214,772 | $222,335 | 3.5% |
| Travel Receipts (for all purposes including education) | $173,130 | $179,039 | 3.4% |
| Travel Spending | $135,560 | $139,090 | 2.6% |
| Medical/Education/Workers Spending | $37,570 | $39,949 | 6.3% |
| Passenger Fare Receipts | $41,642 | $43,296 | 4% |
| Imports (Payments) | Jan-Dec 2013 | Jan-Dec 2014 | YTD Change |
| Total Travel and Tourism-Related Imports | $136,707 | $146,653 | 7.3% |
| Travel Payments (for all purposes including education) | $104,678 | $111,394 | 6.4% |
| Travel Spending | $95,549 | $101,791 | 6.5% |
| Medical/Education/Workers Spending | $9,129 | $9,603 | 5.2% |
| Passenger Fare Payments | $32,029 | $35,259 | 10.1% |
| Balance of Trade | Jan-Dec 2013 | Jan-Dec 2014 | YTD Change |
| Balance of Trade (Surplus/Deficit) | $78,065 | $75,682 | -3.1% |
The following graph tracks the growth of annual travel and tourism exports between 2004 and 2014:
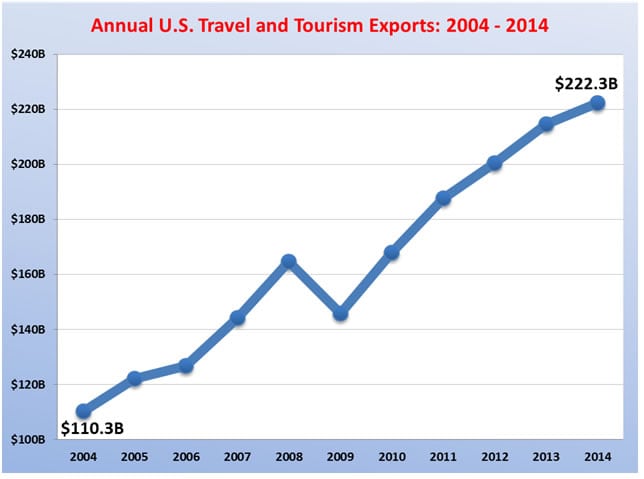
Source: U.S. Department of Commerce, National Travel and Tourism Office and the Bureau of Economic Analysis.
Up Next

How Data Quality Issues Impact Global Hospitality Operations

Thailand Expects a Tourism Boom From Season 3 of 'The White Lotus'
Hyatt Buys Playa for $2.6 Billion in Bet on All-Inclusive Resorts