Most Popular Hotels on Business Travelers' Expense Reports

Skift Take
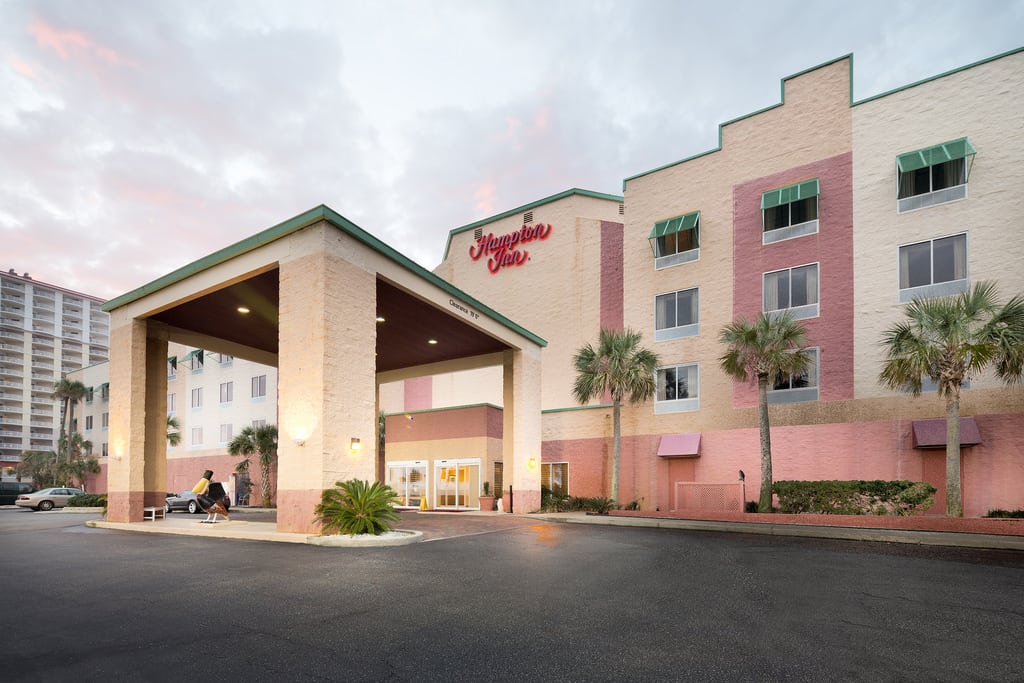
It's a battle between Marriott and Hilton's Hampton Inn as the two brands flip-flopped in the third quarter, with Hampton Inn coming in as the most-expensed hotel among clients of travel and expense solutions' provider Certify.
Hampton Inn had the highest percentage of overall hotel spend at 8.68% in the third quarter, according to a Certify just-released Certify report.. This is up from 7.94% in the second quarter.
Marriott, the most expensed hotel in the second quarter (8.66%), fell to the number two spot (8.33%) in the third quarter.
Overall, 46.2% of hotel expenses among Certify's clients were miscellaneous and included non-chains in the third quarter, down from 48% in the second quarter.
While Hampton Inn was the most-expensed brand, business travelers still spent more at Marriott, $244 on average in the third quarter, $4 more than in the second quarter. Travelers spent $216 on average at Hampton Inn in the third quarter, $11 more than in the second quarter.
Most Expensed Hotels By Percentage of Overall Spend
| Vendor | % of Total Expenses | Avg. Cost |
|---|---|---|
| HAMPTON INN | 8.68% | $216.93 |
| MARRIOTT | 8.33% | $244.94 |
| COURTYARD BY MARRIOTT | 6.10% | $168.12 |
| HOLIDAY INN | 4.27% | $174.19 |
| HOLIDAY INN EXPRESS | 4.07% | $215.67 |
| HILTON | 4.04% | $204.00 |
| DOUBLETREE | 3.88% | $190.71 |
| HILTON GARDEN INN | 3.83% | $203.36 |
| HYATT | 2.00% | $217.30 |
| FAIRFIELD INN | 1.76% | $207.78 |
| COMFORT INN | 1.72% | $145.52 |
| SHERATON | 1.63% | $233.03 |
| EMBASSY SUITES | 1.15% | $217.53 |
| BEST WESTERN | 1.01% | $210.79 |
| RESIDENCE INN | 0.91% | $284.78 |
| *Miscellaneous | 46.62% | NA |
Source: Certify
Business travelers still love their fast-food, but expense percentages at some of the most popular restaurants decreased for the third quarter, according to the report.
As in the second quarter, although 81% of restaurant expenses come from miscellaneous eateries, including non-fast food restaurants, the fast-food restaurants continue holding the largest share of expenses on an individual basis in the third quarter.
Starbucks still commanded the top spot as the most-expensed restaurant-related establishment in the third quarter, but its expense percentage decreased, falling from 4.76% in the second quarter to 4.57% in the third quarter. The good news for Starbucks is its spending average increased among road warriors who are Certify clients, rising from $9.99 in the second quarter to $10.83 in the third quarter.
McDonald's, the second most-expensed restaurant in the third quarter, saw its percent of total expenses increase from 2.68% in the second quarter to 2.99% in the third quarter. But it seems business travelers aren't spending as much at the restaurant as they did in quarter second quarter. McDonald's spending average decreased from $8.17 in the second quarter to $7.66 in the third quarter.
Most Expensed Restaurants
| Vendor | % of Total Expenses | Avg. Cost |
|---|---|---|
| STARBUCKS | 4.57% | $10.83 |
| MCDONALD’S | 2.99% | $7.66 |
| SUBWAY | 1.80% | $14.99 |
| PANERA BREAD | 1.60% | $37.61 |
| DUNKIN DONUTS | 1.20% | $11.34 |
| HMS HOST | 1.14% | $16.17 |
| CHICK-FIL-A | 0.87% | $22.01 |
| WENDY’S | 0.78% | $9.32 |
| BURGER KING | 0.68% | $8.85 |
| APPLEBEE’S | 0.61% | $34.93 |
| CHIPOTLE | 0.59% | $23.90 |
| JIMMY JOHN’S | 0.56% | $39.17 |
| CHILI’S | 0.54% | $34.18 |
| TACO BELL | 0.44% | $8.81 |
| ARBY’S | 0.43% | $10.11 |
| *Miscellaneous | 81.20% | NA |
Source: Certify
Alaska Airlines joined the list of most-expensed airlines in the third quarter, with just more than 1% of total expenses in the third quarter, while Southwest left the list.
Delta and United continue as the top two expensed airlines, with Delta's expense percentage increasing from 20.5% in the second quarter to 21.1% in the third quarter while United's stayed at just more than 14%. Travelers spent more on both airlines in the third quarter compared with the second quarter, up from $419 to $420 on average for Delta and up from $432 to $446 for United.
American Airlines and U.S. Airways trailed them in the third and fourth spots, respectively, in the third quarter. If you consider that American Airlines and U.S. Airways merged, their combined expense percentage would be 19.1% of total airline spending for the third quarter, down from 20.08% in the second quarter. The combined spending average for both airlines was $700 for quarter third quarter, up from $676 the previous quarter.
Most Expensed Airlines
| Vendor | % of Total Expenses | Avg. Cost |
|---|---|---|
| DELTA | 21.11% | $420.27 |
| UNITED AIRLINES | 14.29% | $446.82 |
| AMERICAN AIRLINES | 9.79% | $387.63 |
| US AIRWAYS | 9.31% | $313.63 |
| ALASKA AIRLINES | 1.08% | $253.07 |
Source: Certify


