Skift Take
Sure, cutting the average monthly wait time by more than 40% is a significant improvement. But you can bet the international travelers still waiting in those one hour or two hour-plus lines will make it their mission to bad mouth their experience to anyone who will listen.
Automated passport control kiosks can recognize faces, measure height and take fingerprints but apparently they can only dramatically reduce average wait times at some of the U.S. airports using them.
Automated passport control first rolled out for international travelers at Chicago’s O’Hare Airport in July 2013 and since then 23 other U.S. airports implemented the kiosks in their U.S. Customs and Border Protection international arrivals areas. When the kiosks debuted in Chicago and a few months later at New York’s JFK Airport, U.S. officials asserted they would slash average wait times by as much as 40%. They’ve appeared to deliver on that promise at some airports while most have seen mediocre success.
At JFK airport the average wait time for international travelers to complete the two-step arrivals process, using the kiosks and then showing the receipt travelers receive to a Customs Officer, is about 18.5 minutes so far this month based on Customs data. That’s a 65.9% decrease from the 30.7-minute average wait time in March 2013 before the kiosks launched at JFK and this puts JFK at the top of the leaderboard in terms of which airport can claim the most success from the kiosks.
However, the improved overall monthly average wait time doesn’t mean JFK completely overcame its notoriously long Customs wait times.
For example, Delta Air Lines boasted that Customs wait times in its Terminal 4 arrivals facility at JFK were reduced by 90% shortly after the kiosks became available in October 2013 but last week there were still several instances of maximum wait times exceeding two hours in Terminal 4 and average wait times hovered around one hour.
Only four of the 24 airports using the kiosks managed to reduce their average wait time this month by 40% or more compared with March 2013 or 2014 (whichever date came before kiosks were implemented). After JFK, Dallas/Forth Worth International Airport, Houston George Bush Intercontinental Airport and Miami International Airport reduced their average wait times by 51.6%, 45.9% and 40.4%, respectively, for this month compared to either March 2013 or 2014 (see chart below for comparisons).
In March 2015, Miami International Airport’s North Terminal had the highest average wait time (22.1 minutes) among 24 airports and also had the highest average wait time in March 2013 before its kiosks arrived (37.1 minutes). Phoenix Sky Harbor International Airport’s Terminal 4 had the shortest average wait time so far this month (7.9 minutes).
The average wait times at some airports weren’t terrible to begin with before kiosks arrived which could explain why some terminals saw small percentage decreases, but still included excessive wait times of an hour or more in most cases. Some of the airports, such as JFK, Orlando International Airport and Chicago O’Hare Airport, allow travelers from the 38 visa waiver countries to use the kiosks while many, including Phoenix Sky Harbor and Seattle-Tacoma airports., only grant access to U.S. and Canadian citizens.
It’s a given that all of the these airports have varying amounts of international arrivals each year and it’s unfair to expect average wait times at airports with 20 million annual international arrivals to mirror those at airports with only a few million, for example. Still, airports are aware of their needs and realize that they’ll need more kiosks and personnel on hand if they want to make serious dents in their wait times.
We combed through Customs’ airport wait times data for March 2015 and calculated the overall average wait time for the month based on the average wait time for each day. We also compared this number to either March 2013 or 2014 (depending on which month came before kiosks were implemented) to compare how wait times have changed.
The results are below:
Ranking of U.S. Airports With Largest Percent Decreases in Overall Average Wait Time From Using Automated Passport Control Kiosks for March 2015 Compared to Either March 2013 or March 2014
| Rank | Airport/Terminal | Avg. Wait Time March 2013 (Minutes) | Avg. Wait Time March 2014 (Minutes) | Avg. Wait Time March 2015 (Minutes) | % Decrease | Month Kiosks Were Implemented |
|---|---|---|---|---|---|---|
| 1 | New York JFK Airport | 30.7 | 18.5 | 65.90% | Implemented October 2013 | |
| 2 | Dallas/Forth Worth Airport Terminal D | 23.6 | 11.4 | 51.60% | Implemented January 2014 | |
| 3 | Houston George Bush Intercontinental Airport Terminal IAB | 26.1 | 14.1 | 45.90% | Implemented January 2014 | |
| 4 | Miami International Airport North Terminal | 37.1 | 22.1 | 40.40% | Implemented November 2013 | |
| 5 | Chicago Midway Airport Main Terminal | 12.7 | 7.7 | 39.30% | Implemented March 2014 | |
| 6 | Chicago O’Hare Airport Terminal 5 | 21.4 | 13.6 | 36.40% | Implemented July 2013 | |
| 7 | Tampa International Airport Airside F Terminal | 16.3 | 10.4 | 36.20% | Implemented August 2014 | |
| 8 | Los Angeles International Airport Terminal 5 | 24.1 | 16.04 | 33.40% | Implemented June 2014 | |
| 9 | Charlotte Douglas Airport Main Terminal | 12.7 | 8.5 | 33.07% | Implemented May 2014 | |
| 10 | Minneapolis-Saint Paul International Airport Terminal 1 | 16.9 | 11.5 | 31.90% | Implemented October 2014 | |
| 11 | Austin-Bergstrom International Airport Main Terminal | 18.7 | 12.9 | 31.02% | Implemented March 2015 | |
| 12 | Orlando International Airport Airside, Airside 4 Terminals | 24.3 | 17.03 | 29.90% | Implemented February 2014 | |
| 13 | Los Angeles International Airport Tom Bradley Terminal | 20.2 | 14.6 | 27.70% | Implemented September 2014 | |
| 14 | Boston Logan International Airport Terminal E | 19.2 | 14.5 | 24.40% | Implemented July 2014 | |
| 15 | Washington Dulles Airport Terminal A | 12.1 | 9.2 | 23.90% | Implemented October 2014 | |
| 16 | Atlanta Hartsfield-Jackson Airport Concourse E, Concourse F | 11.7 | 9.1 | 22.20% | Implemented May 2014 | |
| 17 | San Diego International Airport Terminal 2 | 12.5 | 9.9 | 20.80% | Implemented January 2015 | |
| 18 | Seattle-Tacoma Airport South Satellite Terminal | 10.8 | 9.07 | 16.02% | Implemented January 2014 | |
| 19 | Phoenix Sky Harbor Airport Terminal 4 | 9.3 | 7.9 | 15.05% | Implemented July 2014 | |
| 20 | Newark Liberty Airport Terminal C | 14.1 | 12.7 | 9.90% | Implemented June 2014 | |
| 21 | Fort Lauderdale-Hollywood Airport Terminal 4 | 22.1 | 20.3 | 8.10% | Implemented March 2014 | |
| 22 | Denver International Airport Concourse A | 11.6 | 10.8 | 6.90% | Implemented October 2014 | |
| 23 | Detroit Metro Airport McNamara Terminal | 14.04 | 13.07 | 6.91% | Implemented July 2014 | |
| 24 | Philadelphia International Airport Terminal A | 13.4 | 12.5 | 6.70% | Implemented October 2014 |
Source: U.S. Customs and Border Protection data
The Daily Newsletter
Our daily coverage of the global travel industry. Written by editors and analysts from across Skift’s brands.
Have a confidential tip for Skift? Get in touch
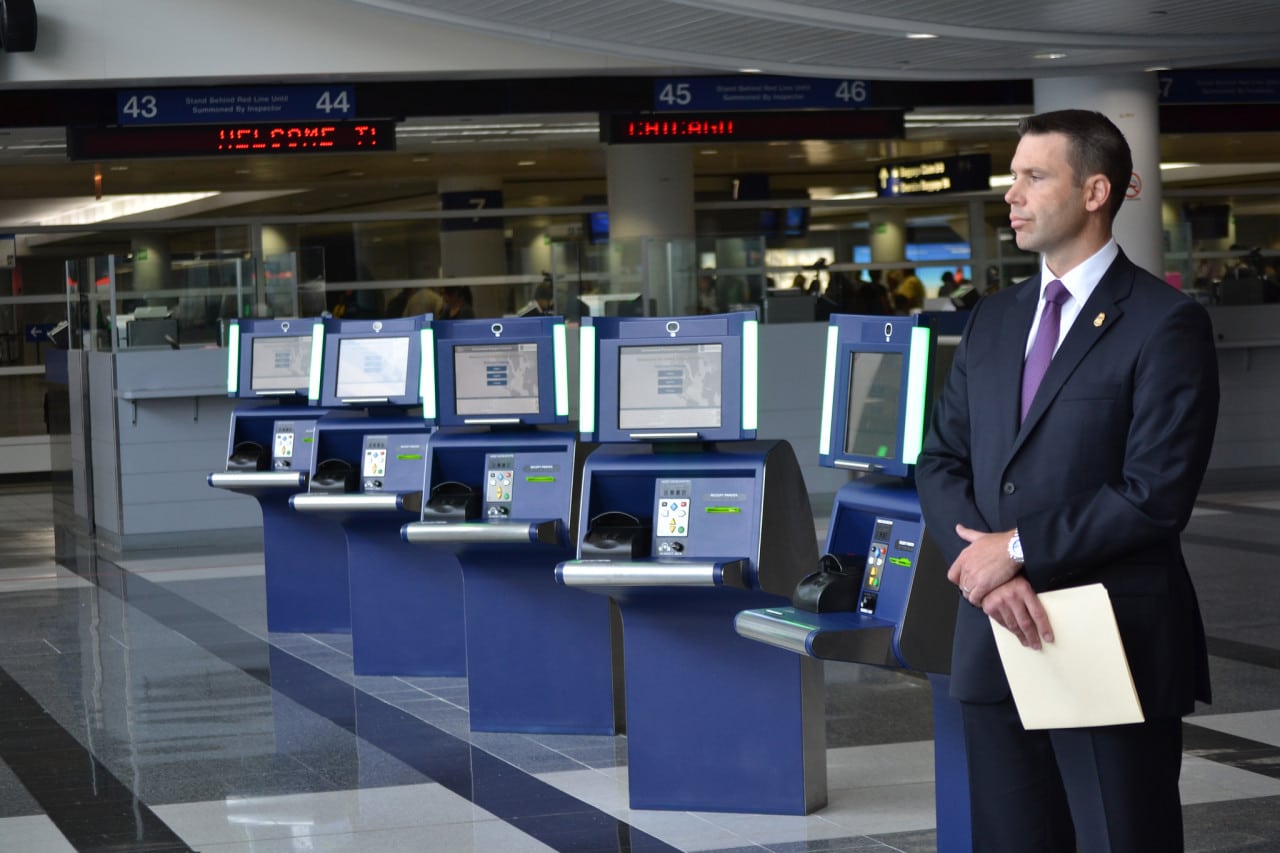
Photo credit: Automated passport control kiosks at Chicago O'Hare Airport in 2013. Kristoffer Grogan / U.S. Customs and Border Protection