Skift Take
Not that we're taking the airlines' sides, but poor management at airports is also a big reason for delays and it's nice to see Silver trying to highlight that in his new tool.
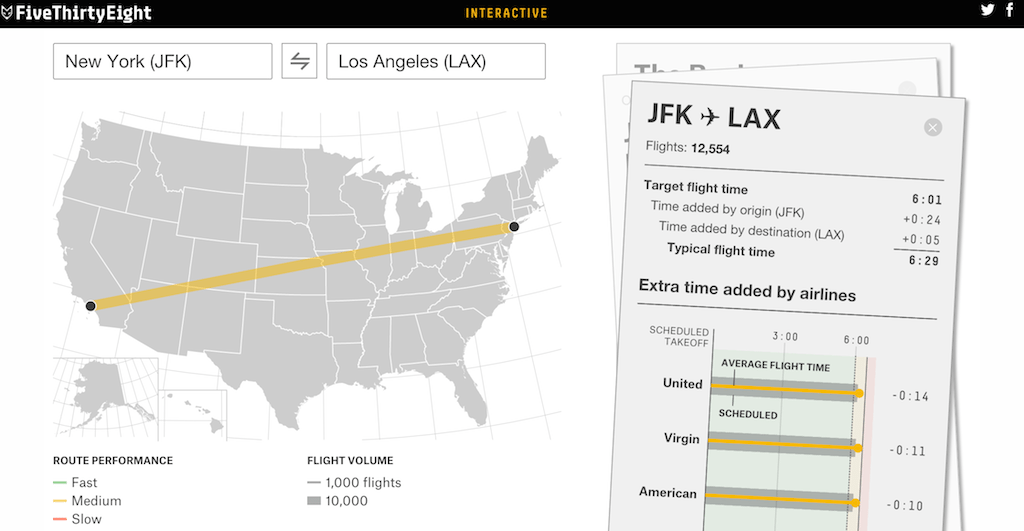
The ESPN FiveThirtyEight blog’s Which Flight Will Get You There Fastest interactive tool for U.S. airlines and airports finally makes comparing different carriers’ performances for particular routes easier while spotlighting airports’ blame in flight delays.
Launched this week, the tool shows travelers which airlines will get them to their destinations the fastest offering side-by-side comparisons of how long a route should take to fly versus how long a given carrier actually takes to fly the route and revealing how much delay time airports add to the equation.
New York’s JFK Airport, Newark Liberty International, and Chicago O’Hare are some of America’s busiest airports, often causing flight delays beyond airlines’ control.
FiveThirtyEight’s founder and Editor-in-Chief Nate Silver, who designed the tool, argues airlines could put their hubs at more efficient airports less prone to sluggish operations. That’s wishful, if not silly thinking on Silver’s part (major cities are hubs for a reason), which is why travelers may find value in his tool to keep track of which airlines perform best at certain airports. Silver is using the Bureau of Transportation Statistic’s monthly data that is already available to the public, but FiveThirtyEight’s data tools making it easier to comprehend.
Silver’s defines his purpose for creating the tool in three parts: the inequality of delays, exposing regional carriers’ slowness, and airlines padding their schedules. Silver found the six million domestic flights the U.S. government tracked last year experienced 115 million minutes worth of delays yet 54% of flights still arrived on-time due to 35 million minutes worth of early arrivals, which the tool will help chart.
The statistician also points out regional carriers operate about half of all U.S. domestic flights on behalf of major carriers, with Envoy Air averaging 26-minute delays compared to the 13-minute delays of its parent American Airlines, for example. Silver also wants travelers to see which airlines run the tightest schedules to advocate that if airlines simply add five or ten minutes onto their flight times the government would consider more flights “on-time.” Frontier Airlines is one notable example as it subtracts an average of 5.6 minutes off its flight times leaving its on-time percentage below 75%.
Average Time the Country’s Busiest Airports Add to a Trip (in Minutes)
| Airport | Departures | Arrivals |
|---|---|---|
| Atlanta ATL | +0:07 | +0:07 |
| Baltimore BWI | +0:10 | +0:05 |
| Boston BOS | +0:12 | +0:04 |
| Charlotte CLT | +0:10 | +0:09 |
| Chicago ORD | +0:16 | +0:22 |
| Dallas/Fort Worth DFW | +0:05 | +0:11 |
| Denver DEN | +0:03 | +0:06 |
| Detroit DTW | +0:09 | +0:08 |
| Houston IAH | +0:04 | +0:05 |
| Las Vegas LAS | +0:03 | +0:02 |
| Los Angeles LAX | +0:02 | +0:05 |
| Minneapolis MSP | +0:05 | +0:05 |
| New York LGA | +0:27 | +0:22 |
| New York JFK | +0:24 | +0:19 |
| Newark EWR | +0:24 | +0:25 |
| Orlando MCO | +0:04 | +0:03 |
| Phoenix PHX | +0:02 | +0:04 |
| Salt Lake City SLC | 0:00 | +0:01 |
| San Francisco SFO | +0:10 | +0:14 |
| Seattle SEA | +0:02 | +0:05 |
Source: FiveThirtyEight
The Daily Newsletter
Our daily coverage of the global travel industry. Written by editors and analysts from across Skift’s brands.
Have a confidential tip for Skift? Get in touch
Tags: data, flight tracking
Photo credit: Data from FiveThirtyEight's new "Which Flight Will Get You There Fastest?" tool showing results for flights between New York's JFK Airport and Los Angeles International Airport. FiveThirtyEight