Stat Snapshot: Adding Up the U.S. Travel Trade Surplus
Skift Take
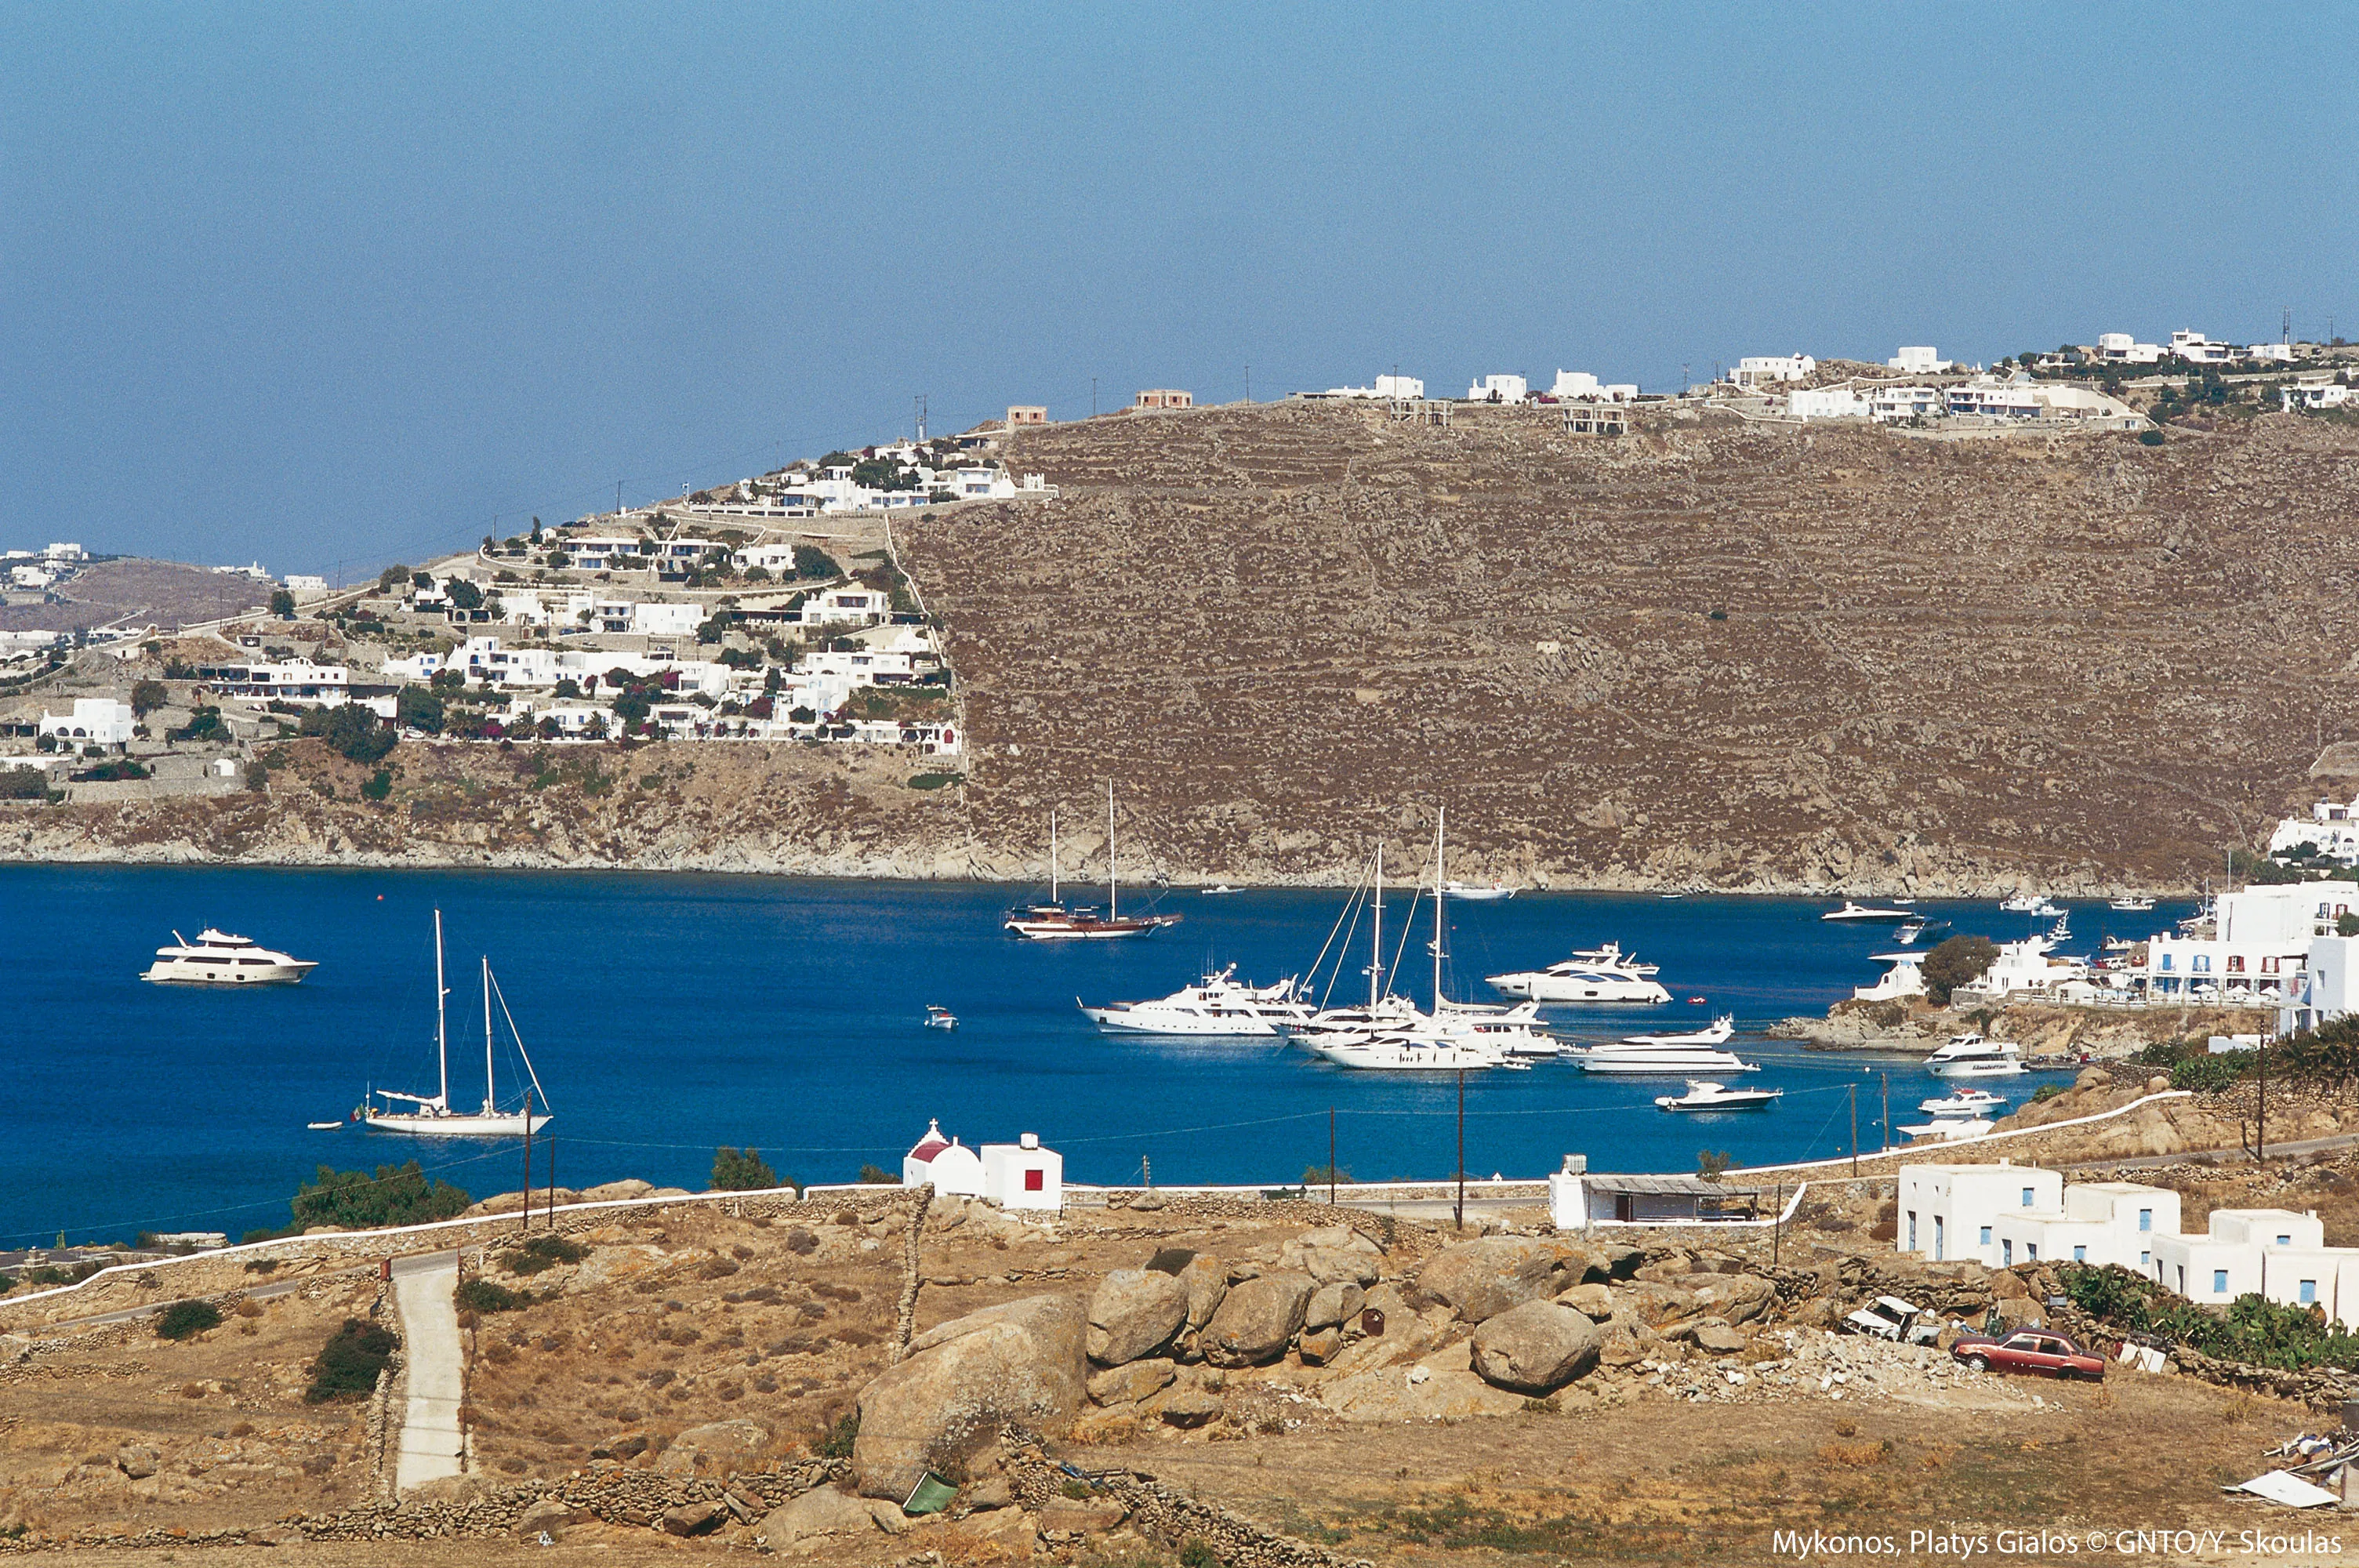
The U.S. has attracted more tourism dollars than its residents have spent overseas for at least 14 years, according to data released last month by the Office of Travel and Tourism Industries.
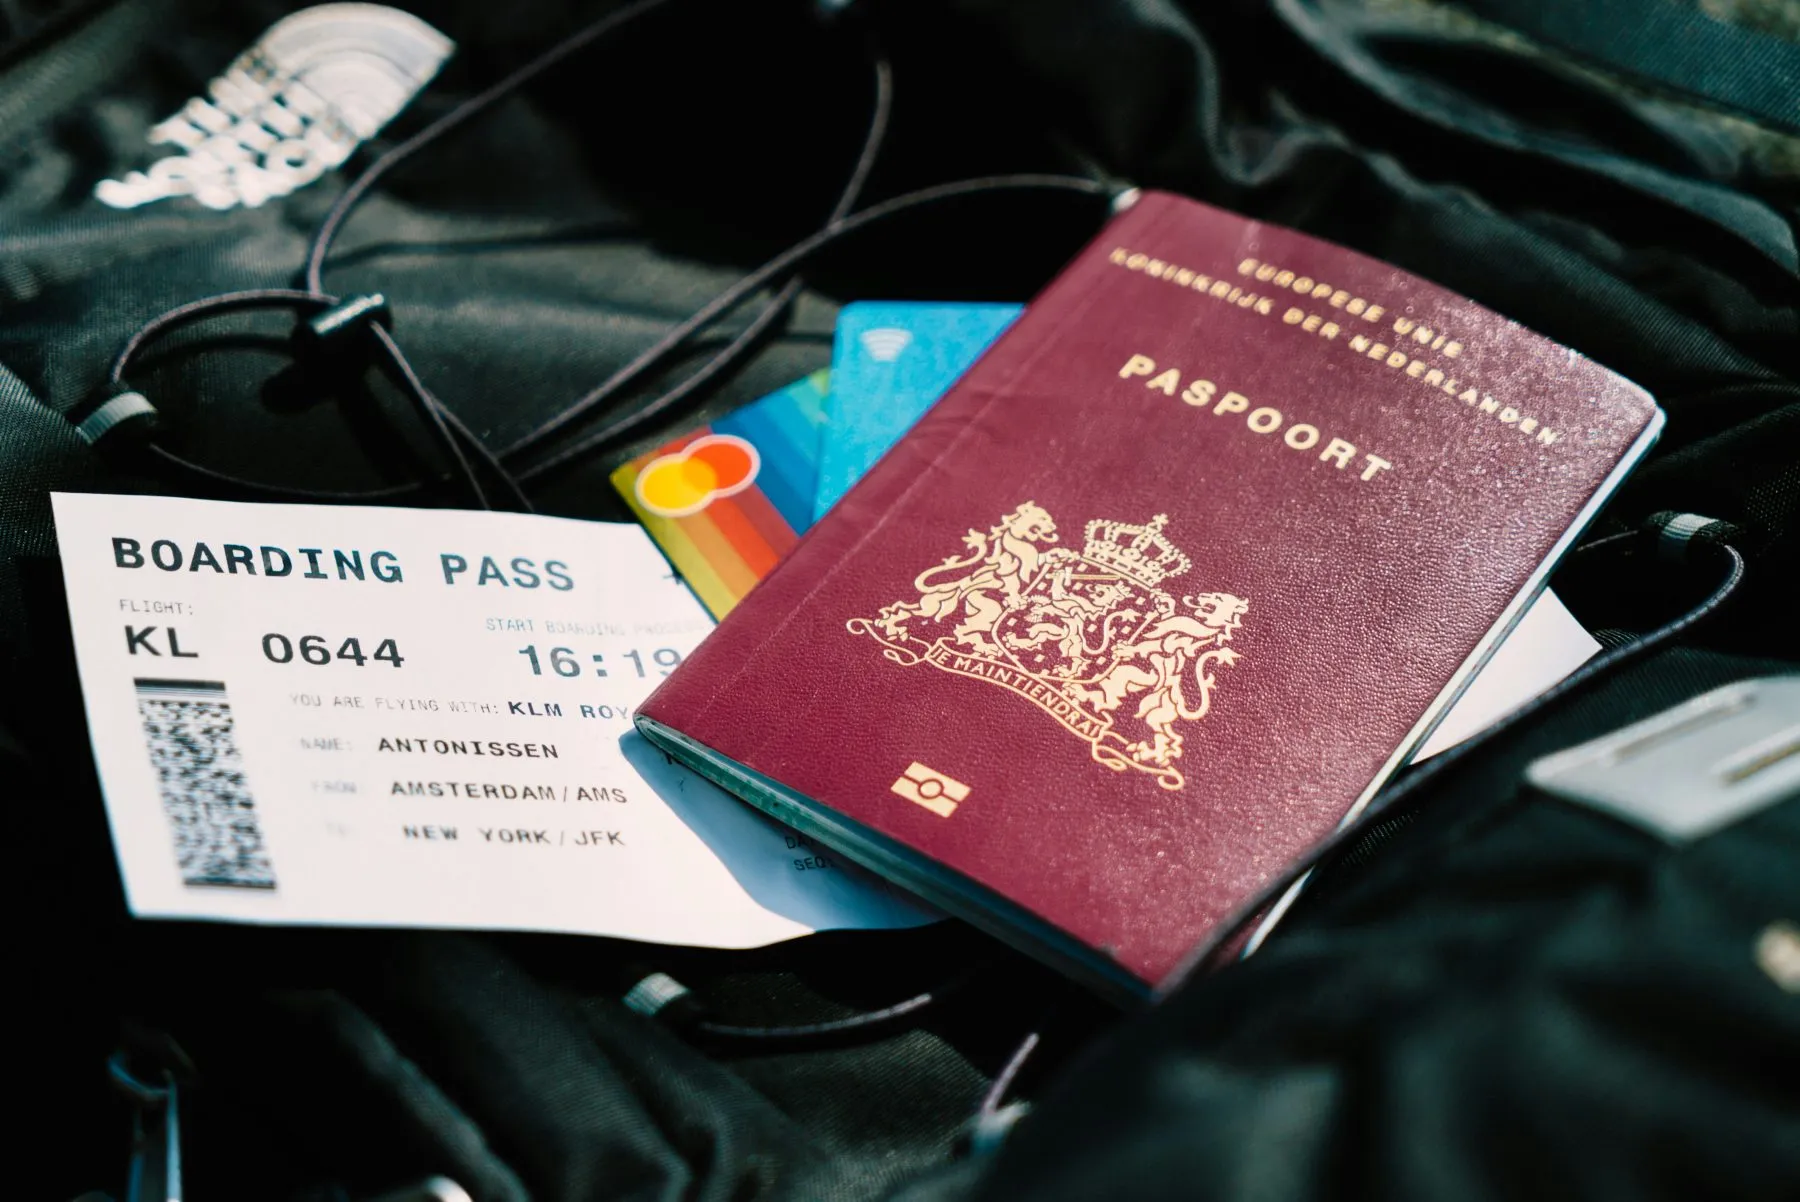
Exports -- which includes money spent by foreigners on passenger airfares, local transportation, food, gifts, entertainment, medical care, and education -- consistently outweighs imports -- money spent by Americans on the same travel costs overseas.
The monthly balance of trade surplus has swayed between $1 billion and $7 billion for the past 14 years.
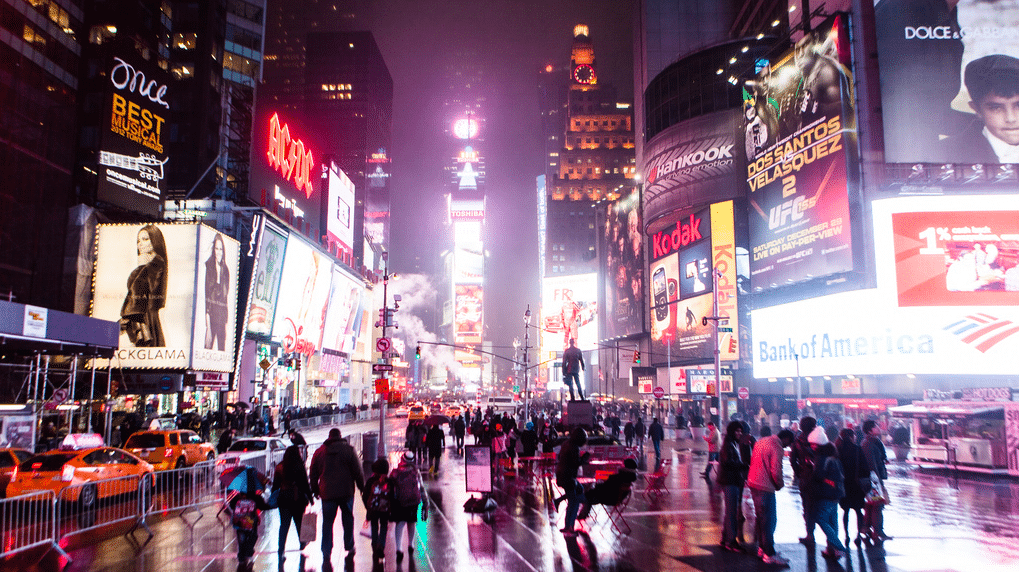
Although the number of Americans traveling overseas is increasing (up 2 percent to 61.9 million people in 2013), the rate of foreign visitation to the U.S. is growing even faster. The U.S. welcomed 70 million international visitors, a 5 percent increase year-over-year.
The U.S. economy both loses and gains the most in tourism spend during the last quarter of the year.
Monthly tourism spend brought into the country via foreign visitors is consistently the highest in December. The highest monthly imports, or money spent by Americans overseas, usually take place in November.
Below is a chart outlining the monthly surplus of trade for the past 10 years:
Travel Trade Surplus 2004-2014
| Year | Jan | Feb | March | April | May | June | July | Aug | Sept | Oct | Nov | Dec |
|---|---|---|---|---|---|---|---|---|---|---|---|---|
| 2013 | $6,568 | $6,559 | $6,349 | $6,280 | $6,515 | $6,345 | $6,464 | $6,808 | $6,675 | $6,359 | $6,562 | $6,581 |
| 2012 | $5,320 | $5,442 | $5,757 | $5,986 | $5,947 | $6,113 | $5,682 | $6,369 | $6,012 | $5,680 | $6,167 | $6,255 |
| 2011 | $5,554 | $5,569 | $5,752 | $5,838 | $6,020 | $6,244 | $6,184 | $6,315 | $5,928 | $5,967 | $5,888 | $5,926 |
| 2010 | $4,191 | $4,316 | $4,531 | $4,449 | $4,672 | $4,869 | $5,037 | $5,071 | $5,090 | $5,180 | $5,157 | $5,385 |
| 2009 | $3,541 | $3,301 | $3,347 | $3,452 | $3,779 | $3,813 | $3,555 | $3,519 | $3,438 | $3,741 | $3,637 | $3,930 |
| 2008 | $3,282 | $3,209 | $3,916 | $3,505 | $4,199 | $4,389 | $4,166 | $4,133 | $3,707 | $3,801 | $2,969 | $3,606 |
| 2007 | $2,037 | $1,857 | $2,291 | $2,035 | $2,404 | $2,573 | $2,655 | $2,629 | $2,721 | $3,205 | $3,343 | $3,686 |
| 2006 | $1,937 | $1,402 | $1,371 | $1,519 | $1,543 | $1,575 | $1,914 | $2,007 | $1,880 | $1,559 | $1,559 | $1,663 |
| 2005 | $1,620 | $1,768 | $1,844 | $1,987 | $1,901 | $1,816 | $1,721 | $1,697 | $1,580 | $1,640 | $1,398 | $1,686 |
| 2004 | $1,294 | $1,311 | $1,608 | $1,389 | $1,188 | $1,237 | $1,488 | $1,138 | $1,209 | $1,308 | $1,415 | $1,497 |
Amounts in millions, seasonally adjusted
Source: Office of Travel and Tourism Industries
Up Next

How Data Quality Issues Impact Global Hospitality Operations

The White Lotus Effect Could Be a Disaster for Thailand's Koh Samui - And Travel Media Is Making it Worse
Travel Startups Raise $580 Million Over Two Weeks
Tariffs and Travel: What Trump’s Trade Moves Could Mean for Airlines