Where Do Americans Spend Their Travel Dollars? New Skift Research

Skift Take
The U.S. is one of the most diverse countries in the world, and its residents' travel habits reflect that. That makes studying different demographics and travel-spending categories key to understanding the American traveler.
In this report, we're able to answer questions like how many Americans travel and what does a typical American spend on travel in a given year?
We're able to break these answers down into four top-level categories — transportation, lodging, food and drink, and entertainment — as well as several subcategories that are contextualized relative to each other, relative to general year-round consumer spending, and as average household spends.
Further, we break down travel spending by a number of important demographics and are also able to present it in a historical context with data spanning the time frame from 1997–2017.
Taken together, Skift Research aims to provide travel executives with the key statistics they can use to better understand — and ultimately drive more business with — American consumers.
Last week, we launched the latest report in our Skift Research service, U.S. Traveler Profile and Key Statistics.
Below is an excerpt from our Skift Research Report. Get the full report here to stay ahead of this trend.
Preview and Buy the Full Report
Aggregate U.S. Consumer Spending on Travel
Skift Research estimates that American consumers spent an aggregate of $480 billion on travel in 2017, the last year for which data is available.
Our estimates represent direct spending by U.S. consumers on travel goods and services on both domestic and international trips. Importantly these figures exclude spending by business, governments, and non-residents. Direct U.S. consumer spending on travel is an important metric, but readers should be aware of these limitations. Further, our figures do not represent industry estimates as the U.S. travel industry also generates revenues from businesses, non-residents, and governments.
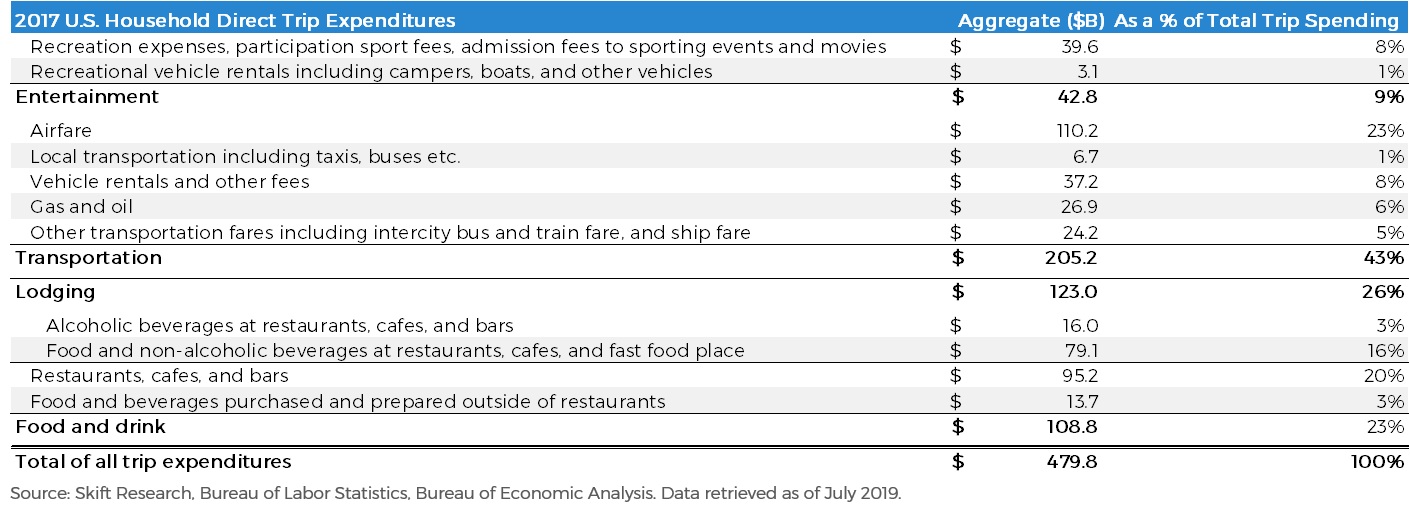
The figure $480 billion is top-level, but how exactly do those dollars get divided up? Exhibit 2 below provides a detailed allocation of trip costs by category.
The single largest type of travel expense in the U.S. is transportation. Americans spent nearly $205 billion on transportation for out-of-town trips in 2017, representing 43 percent of total travel expenditures. A majority of that is the cost of airfare, on which American consumers spend an estimated $110 billion, a quarter of total trip costs (again, this excludes businesses and non-residents). Vehicle rentals are the next largest transportation-related expense for consumers at approximately $37 billion. Also, the American road trip appears to be alive as well, with gas and oil expenses from self-driven travel the third-most prominent transportation expense, at $27 billion in total.
Naturally, lodging is also a major travel expense, coming in at an aggregate of $123 billion spent by U.S. consumers in 2017. Along with transportation, the core logistics of how to get where you are going and where to stay once you get there account for two-thirds of all travel expenses. That means most Americans devote the remaining one-third of their travel budgets to leisure.
The largest of these expenses is dining out, and American consumers spent $95 billion in 2017 on restaurants, cafes, and bars while traveling, or 20 percent of total trip expenses. The other leisure category is entertainment, which represented $43 billion of spend that year. This includes spending on tickets to shows, sporting events, and other recreational expenses.
Preview and Buy the Full Report
Subscribe now to Skift Research Reports
This is the latest in a series of research reports, analyst sessions, and data sheets aimed at analyzing the fault lines of disruption in travel. These reports are intended for the busy travel industry decision-maker. Tap into the opinions and insights of our seasoned network of staffers and contributors. Over 200 hours of desk research, data collection, and/or analysis goes into each report.
After you subscribe, you will gain access to our entire vault of reports, analyst sessions, and data sheets conducted on topics ranging from technology to marketing strategy to deep dives on key travel brands. Reports are available online in a responsive design format, or you can also buy each report à la carte at a higher price.


