State of Travel 2016: Airbnb Vs. Hotel Rivals in 6 Charts
Skift Take
Earlier this season we released our State of Travel 2016 data deck.
In 130+ slides filled with charts, graphs, and data points, we illustrated what's happened recently across all sectors of the travel industry and what direction it is headed in over the following year.
Below, we've pulled out six charts that give us a quick glance of Airbnb's business versus that of hotel brands large and small.
Download the State of Travel 2016
Chart 1
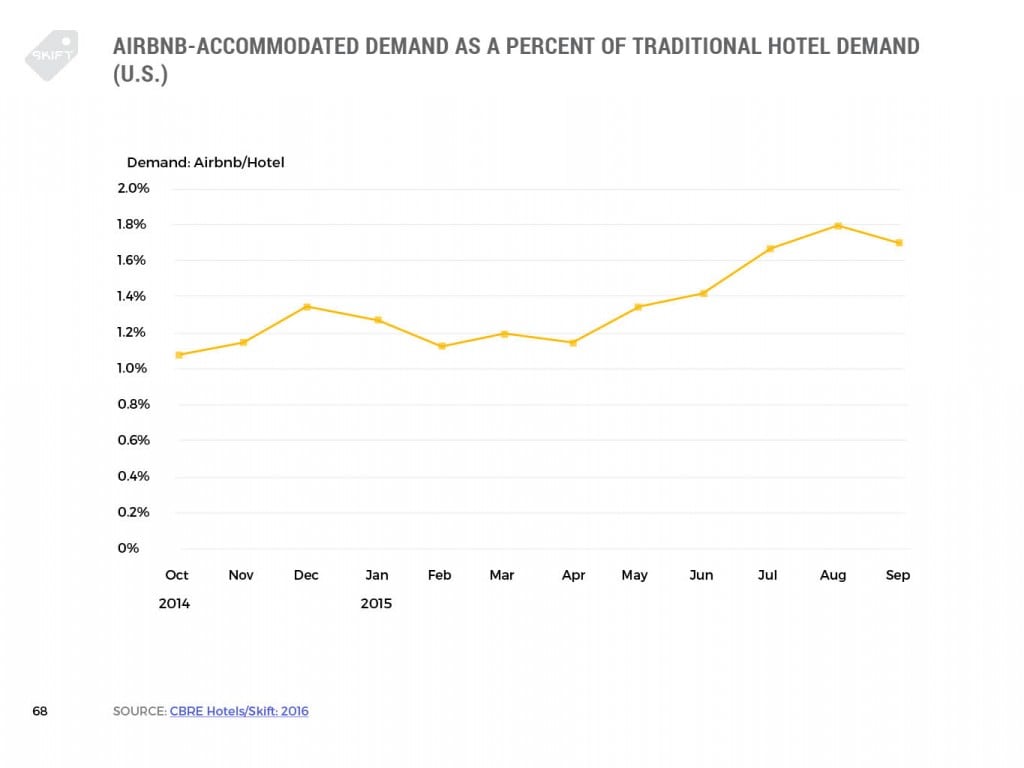
Airbnb's growth is significant, but the unanswered question so far is whether the growth comes at the expense of traditional hotel business or if it is carving out its own, new business. Up against that, of course, is the ambitious growth of hotel brands in cities like New York, where they've been adding rooms at a rapid, double-digit rate over the past six years.
Chart 2
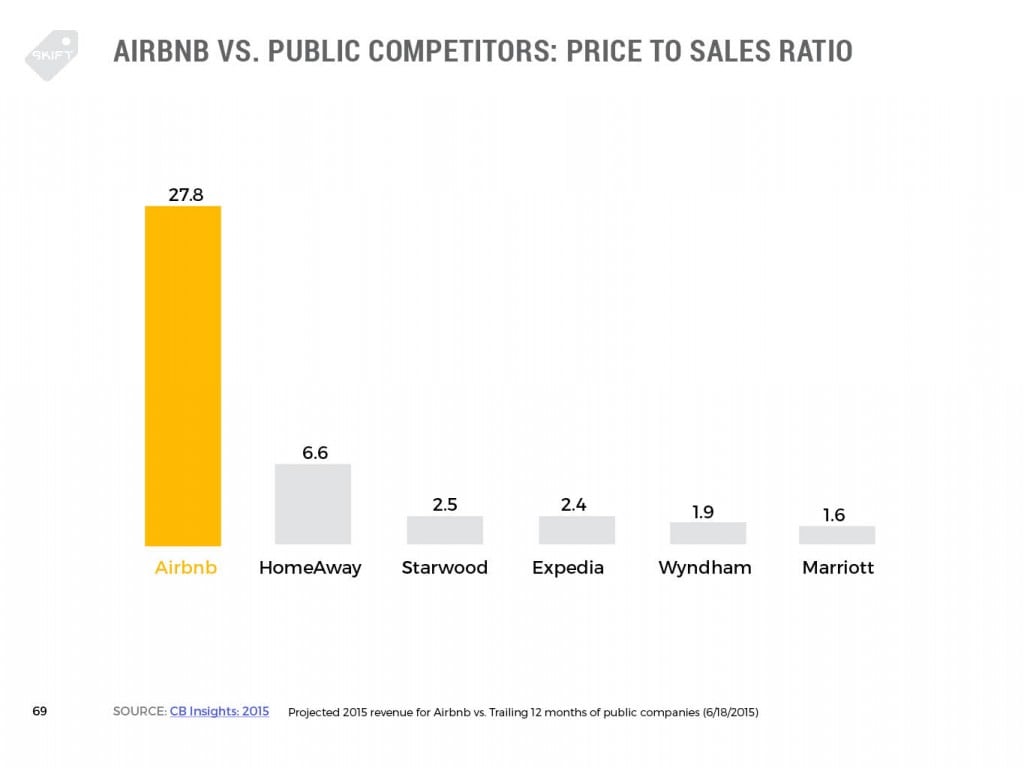
Here's where we see the benefits of being private over being public: No matter how successful you are, you're clearly dealing with different success metrics.
Chart 3
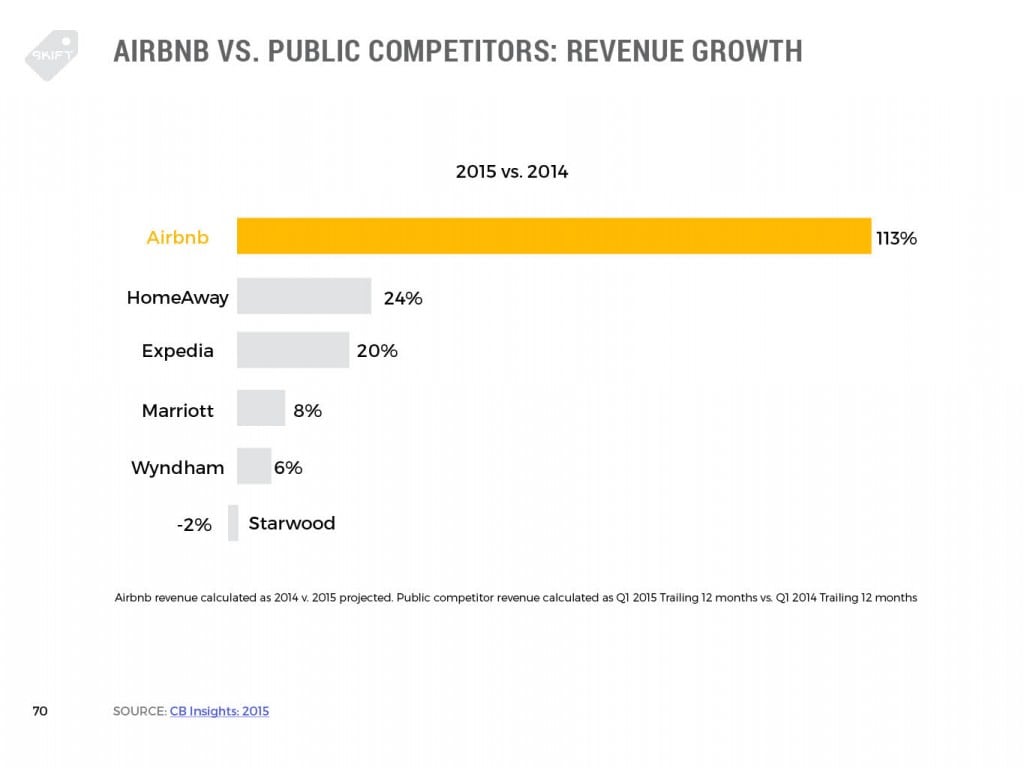
The slide above, appended. Rapid growth is commendable, but it's also easier to achieve at a new company than one that sees steady year-over-year growth.
Chart 4
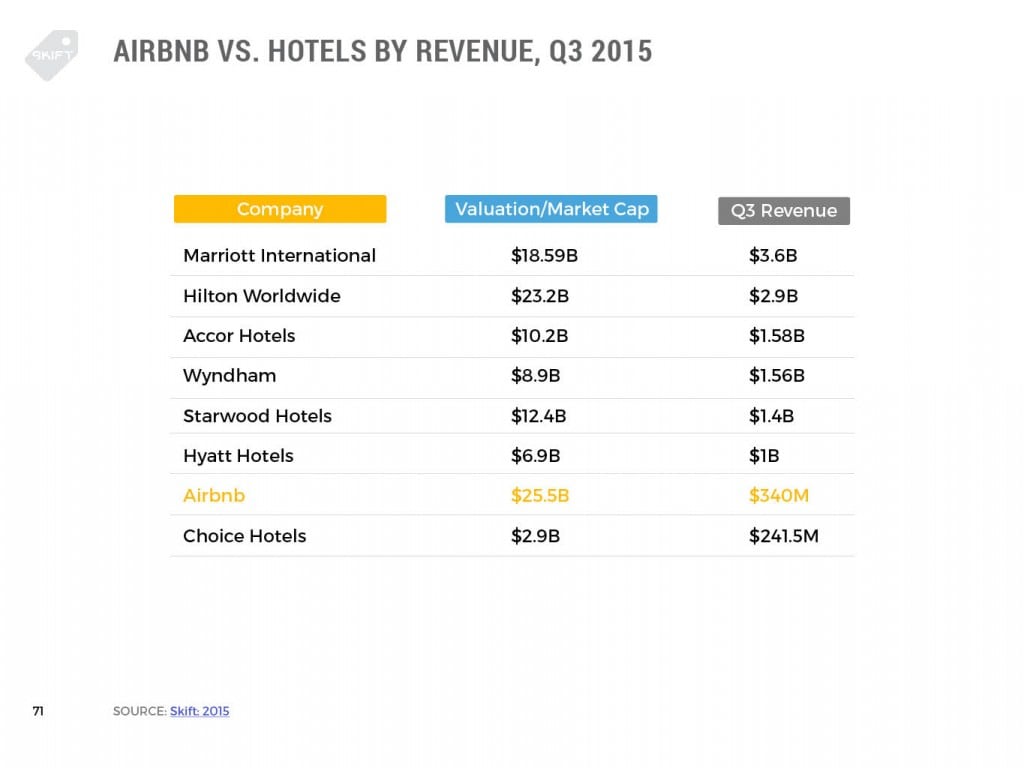
This valuation versus revenue chart suffers from the lack of transparency we see in Chart 2. It also lays out an ambitious growth plan for Airbnb that, in the end, distracts from its enormous impact on the industry. Being worth $5 or $10 billion isn't failure, after all.
Chart 5
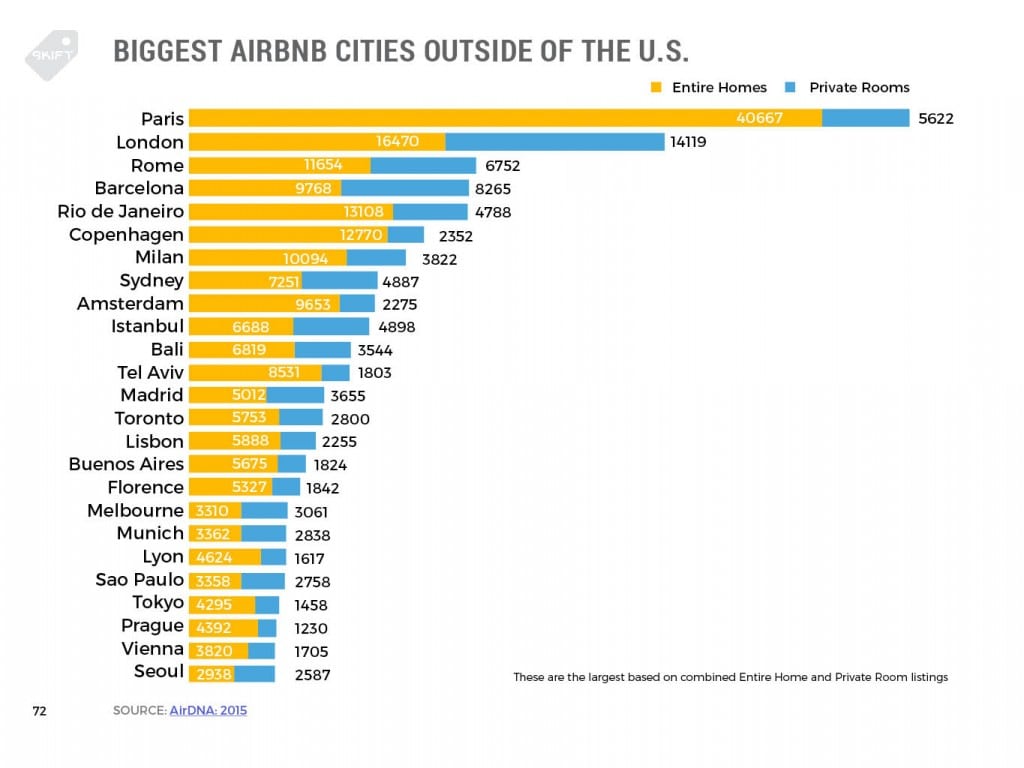
This is where the rubber meets the road, so to speak. Cities such as Paris, London, Rome, and Barcelona are the frontlines of the conflict between Airbnb and cities over issues from bed taxes to affordable housing for locals.
Chart 6
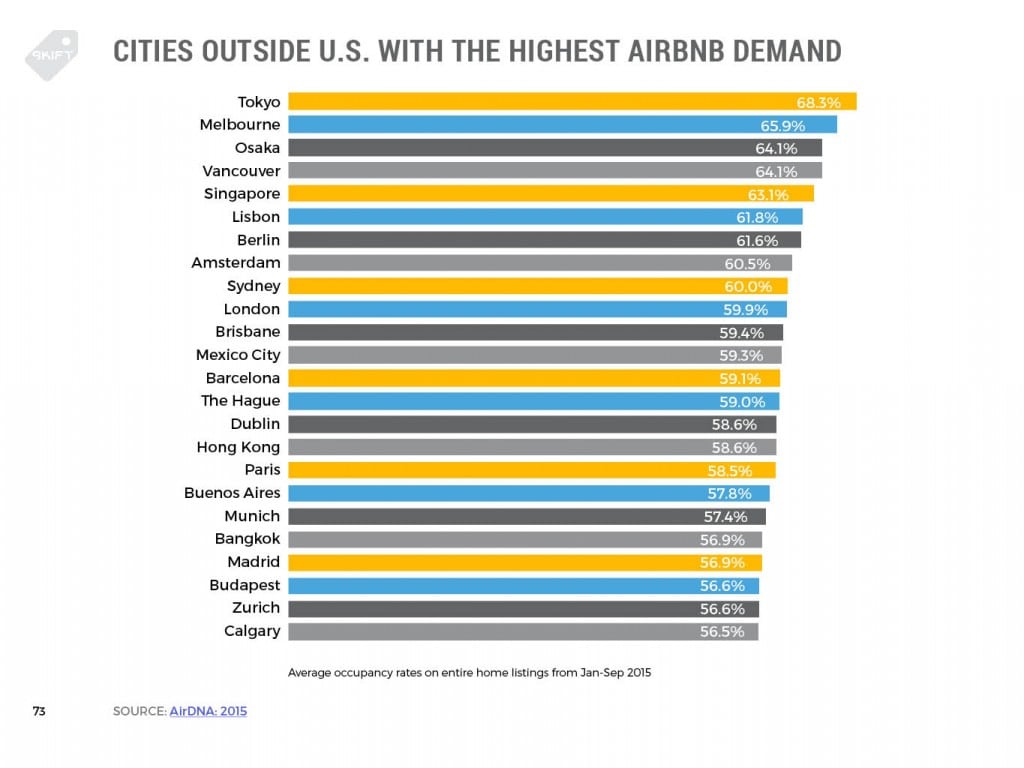
This chart could read as a list of top priorities for hotel brands wishing to develop new properties in new cities. Hint: build three-star, small, and affordable properties in the same neighborhoods.


