Measuring Airbnb's Real Threat to U.S. Hotels Using Industry Metrics

Skift Take
Even if 2016 does not turn out to be the year Airbnb announces an initial public offering, it may turn out to be the year of deep, fascinating Airbnb data — whether the short-term rental service wants to share it or not.
It's already off to a great start.
On the heels of a report about hosts produced by Penn State University for the American Hotel and Lodging Association (AH&LA), CBRE Hotels has released a trove of Airbnb data with market-by-market insights into Airbnb's business in the United States that compares Airbnb data to hotel data.
Like the AH&LA study, it turned to Airdna to provide insight about occupancy, room rates, and availability on Airbnb.
It focused its research into Airbnb because of the company's impact in traditional hotel markets as well as its domination of a competitive set — as measured by Google Trends — that includes VRBO, HomeAway, and FlipKey.
The Study
Unlike AH&LA, which advocates for members of the hotel industry, CBRE focuses on providing intelligence to the real estate community so it can make informed choices about investments and opportunities. "The Sharing Economy Checks In: An Analysis of Airbnb in the United States: Implications on Traditional Hotel Development and Market Performance Going Forward," authored by Jamie Lane, Senior Economist at CBRE Hotels, and R. Mark Woodworth, Senior Managing Director at CBRE, is an exhaustive study of the 59 largest markets for Airbnb in the U.S.
Unlike previous data dives (including our own), CBRE's reports directly contrast Airbnb's metrics with those of the hospitality industry. Using data from Airdna, STR, CBRE, and PKF Hospitality Research (which is now part of CBRE), Lane and Woolworth look at the challenges to hotels in each market, calling out unique challenges in cities like New York and Los Angeles, as well as softer threats in smaller destinations. The authors focused on the period between October 2014 and September 2015.
For each market, the authors look at the equivalent at hotels and Airbnb for average daily rate (ADR), occupancy, and revenue per available room (RevPAR).
This presents a particular challenge as Airbnb's number of rooms is fluid depending on factors such as holidays or special events. All listings are also not created equal, from a two-bedroom luxury offering in a good neighborhood to a very questionable bunk bed in an illegal hostel in a fringe neighborhood.
To keep the comparisons more accurate CBRE also focused on active units; listings that did not receive a booking in the 12 months it studied were left out. It also accounts for seasonality such as New Year's Eve, which demonstrates an elasticity of availability that hotels cannot match. Overall, CBRE cut out 24% of Airbnb's total stock across all markets.
The ADR for Airbnb rooms was $148.42, while hotels had an ADR of $119.11 and a traditional bed and breakfast was $103.25. The report notes, though, that Airbnb units tend to have more services and features than a hotel room, including kitchens, additional bedrooms, and parking, depending on market.
In addition to exerting a downward pressure on hotel room pricing during big events and other crowded periods, this pressure may help hotels avoid overbuilding as well as identify new neighborhoods for development.
"Now that data is becoming available, we think it will be used both to find unsatisfied demand and areas that Airbnb is impacting lodging performance," the report's co-author Jamie Lane, told Skift. "The area that we are still working on is if Airbnb is reducing ADRs in markets, if that will cause fewer hotels to be built in the future."
"Airbnb supply can react to temporary changes in market demand without the need to build additional lodging."
The Charts
In CBRE's conclusion it says clearly that "Airbnb is here to stay." But what this staying power looks like differs from market to market.
The series of charts below put Airbnb and the hotel industry in contrast.
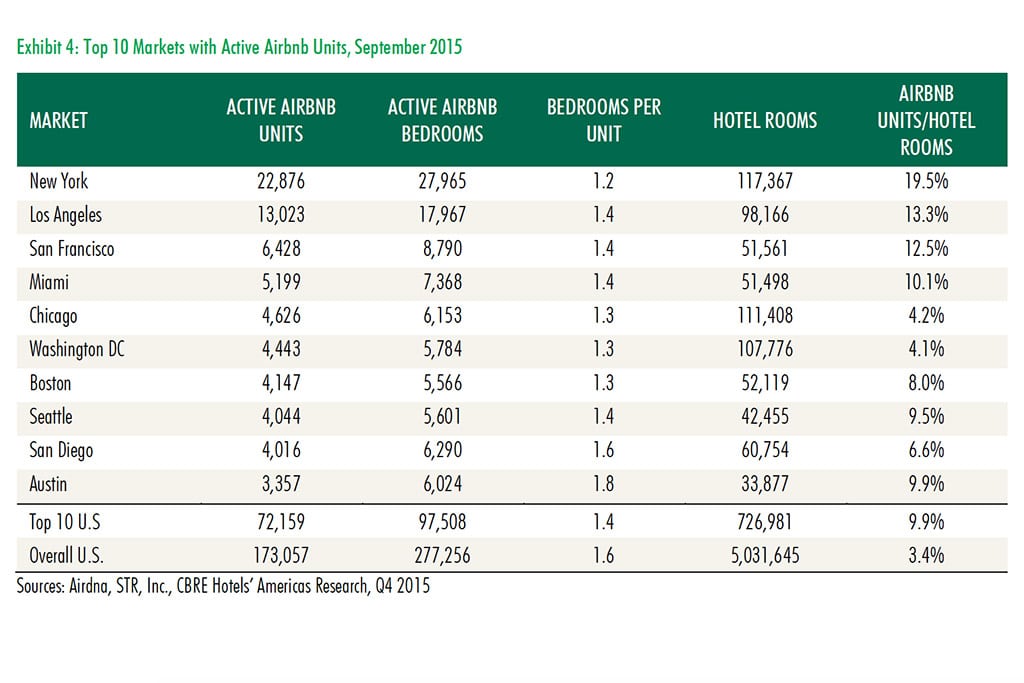
Takeaway: New York City continues to dominate the field and is approaching one listing for every five hotel rooms in the city. But, as the next chart demonstrates, Airbnb's more mature markets are cooling.
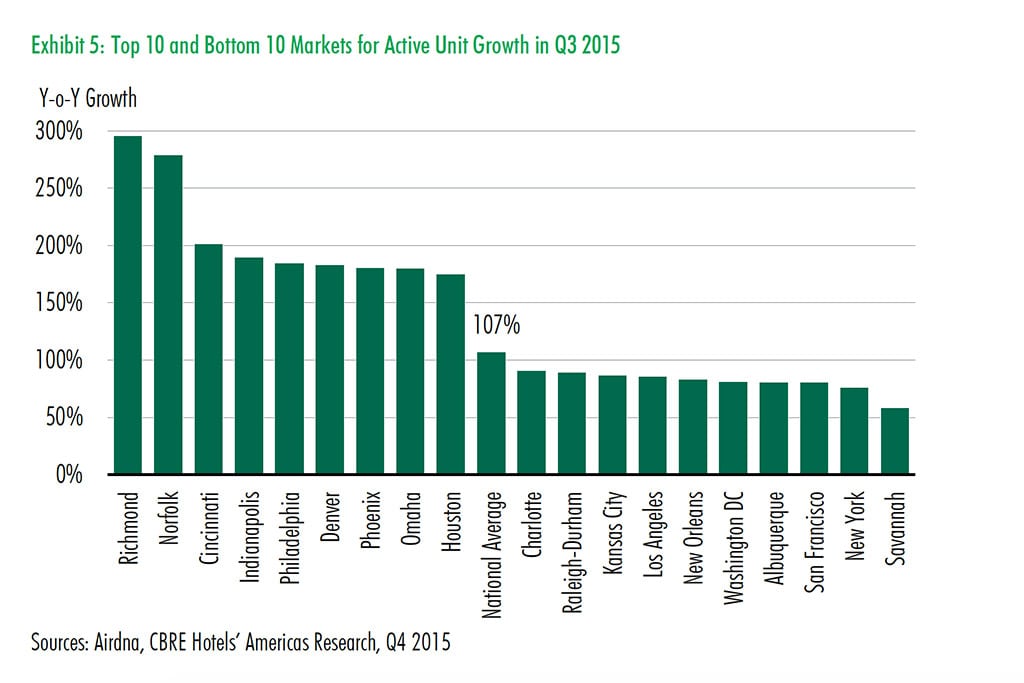
Takeaway: Growth in Airbnb's top markets including New York, San Francisco, and Los Angeles is slowing more than the national average. The rapid growth is still happening in smaller, emerging markets.
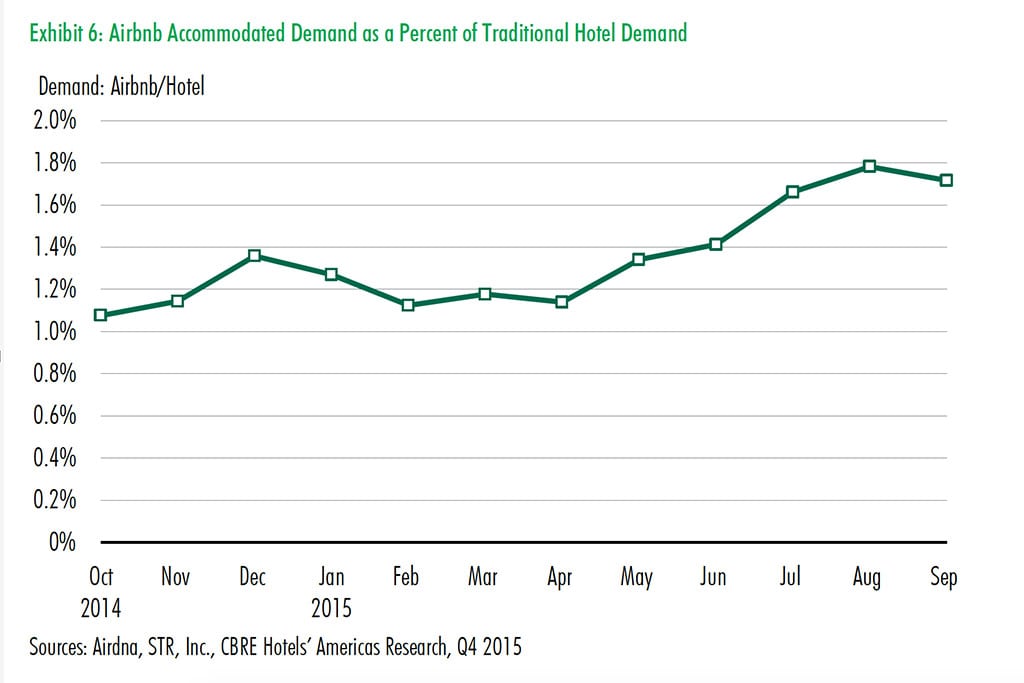
Takeaway: This is the chart that should most worry hotels, especially ones trying to fill rooms during big events and holidays. "The volume of Airbnb demand nationally is rapidly approaching the level of organic growth for hotels."
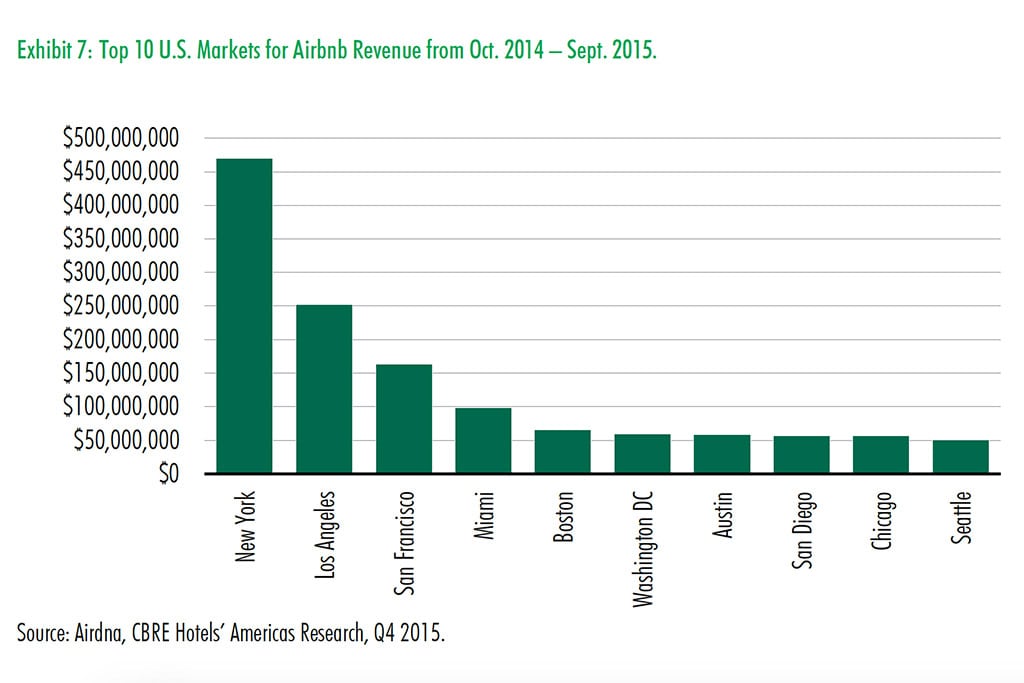
Takeaway: The authors write that "New York is dominating the U.S. market in terms of supply of Airbnb units as well as the number of units booked and revenue generated."
Revenue in New York was almost double that of Los Angeles and triple that of San Francisco, the second and third largest cities by revenue.
"While New York leads in term of revenue," the report reads, "this year-over-year change in revenue was one of the lowest of all major U.S. cities. This suggest that either the market is maturing or the New York Attorney General's increased scrutiny over Airbnb is having an impact on Airbnb's ability to keep growing."
Other markets show similar challenges for growth: "The relatively lower levels of revenue increase may be a function of maturity," the report warns.
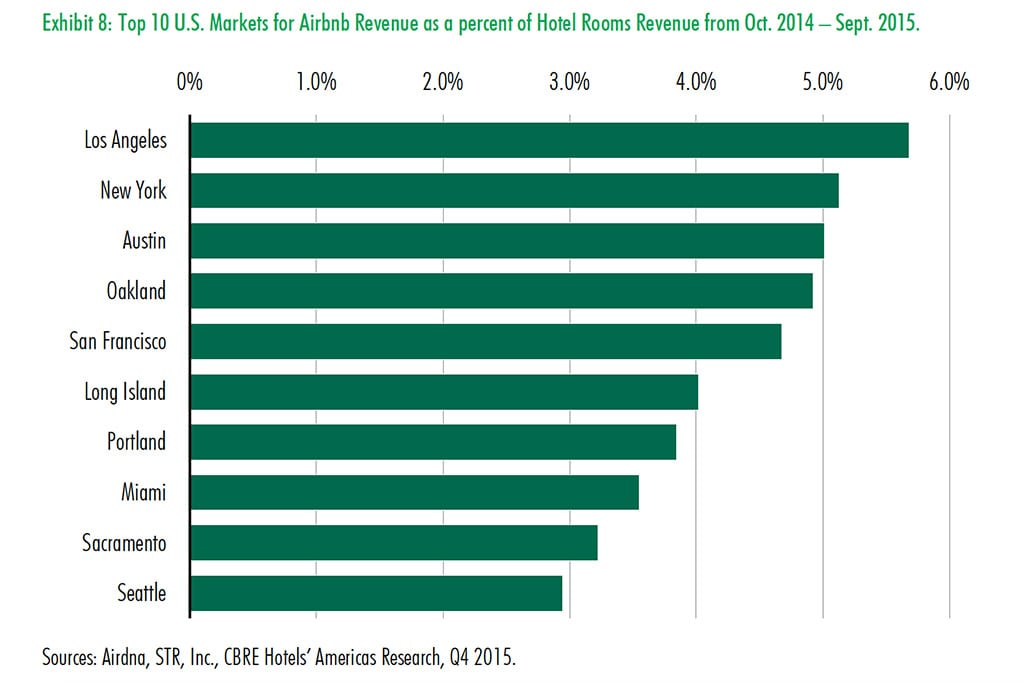
Takeaway: Comparing Airbnb's revenue to hotels on a market-by-market basis shows that it is still in the single digit percentages when compared to hotels. In Los Angeles, hotels generated $4.4 billion in room revenue compared to $250 million for Airbnb.
But then it begins a series of qualifications. "Outside of top markets, it appears that Airbnb is having a minimal impact ... there are only 15 markets where Airbnb generates more than 2% or more of hotel revenue."
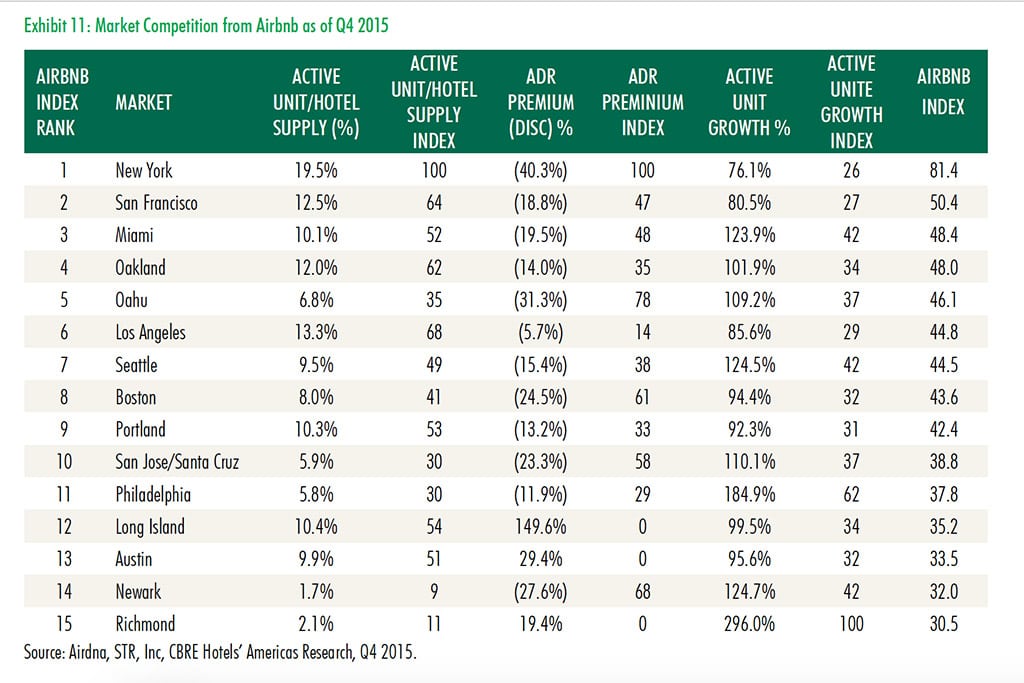 Takeaway: Not all markets are created equal, as we know, and New York offers the biggest threat to traditional hotels.
CBRE's overview is available for free, while its 59 market-specific reports start at $295 each.

