Data from 24 Hours of London Transit Rides Visualized
Skift Take
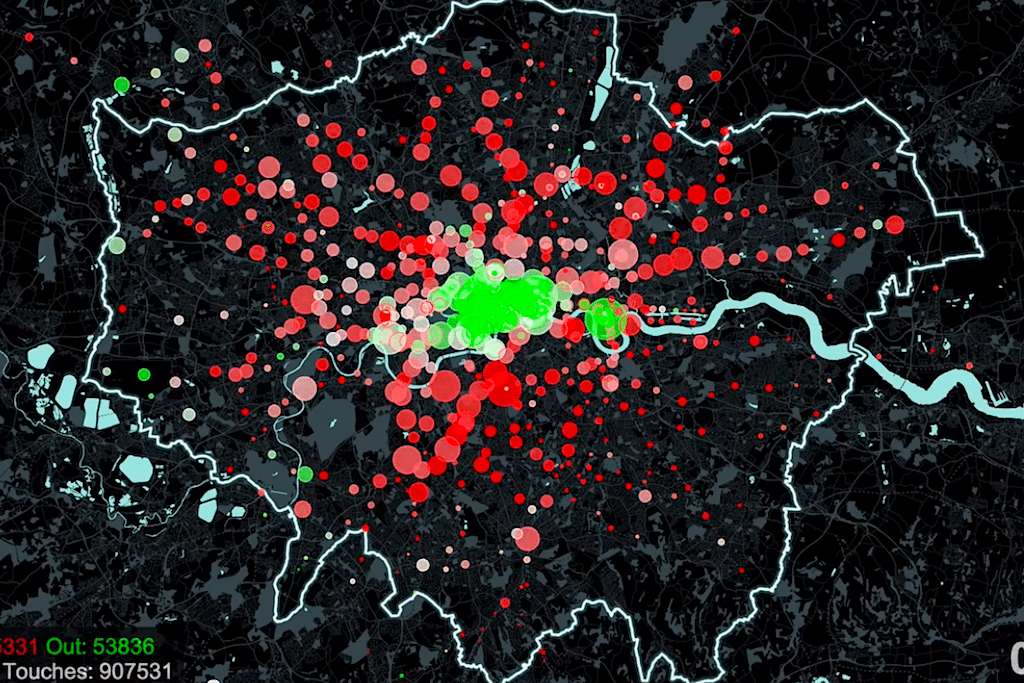
Every week 57 million journeys are taken on London's Tube, rail and bus networks using the Oyster transit smart card.
The following video visualizes the daily traffic on the public transit system using red dots to signify where riders are entering the transit system and green dots to signify where they get out.
The majority of commuters move from outside the city center towards the commercial and business hub. Commuters start heading toward the city center as early as 5:30 am, but the big rush doesn't come until around 8 am.
Most of the dots go white during the middle of day signifying that a near equal number of people are entering and exiting the station. The opposite commute begins around 4:30 pm and continues strong until about 8 pm.
The Oyster card data was supplied by Transport for London.
Up Next

How Travel Brands Can Seize the ‘Q5’ Opportunity on TikTok

Virgin Atlantic Warns of Slowing U.S. Demand

Hilton’s Chris Nassetta Leads in Hotel CEO Pay, With $58.7 Million

Google Unveils 2 New Travel Tools: Hotel Price Alerts and Screenshots for Trip Plans