Skift Take
We're surprised that U.S. hotel chains did not have a stronger global showing, but we're not surprised by Trivago and Airbnb's strength.
When it comes to global accommodations brands, Airbnb and Trivago have an edge that their rivals likely envy.
In a compilation by analytics firm Similarweb of the most visited room booking sites in the U.S., UK, and India, the room-sharing site and hotel metasearch giant were the only two brands to make all three lists.
Note: This is focused on hotel and accommodation sites exclusively, and excludes OTAs that also book vacation packages, airfare, and more.
We have found Similarweb’s traffic stats to be a relatively good barometer of web activity and much more accurate than other traffic comparison sites — at least as far as proportional comparison goes.
Below are charts featuring the top 10s from each market. We’ve highlighted the brand with the highest mobile usage in each: Choicehotels.com, Travelodge.co.uk, and Trivago.in. For booking sites, mobile use is stronger in the U.S. than in the UK or India.
Look below each chart for takeaways for each market.
Top 10 U.S. Accommodations Booking Sites
# | Site | Combined Traffic | Desktop Traffic | Mobile Traffic | Mobile Share |
---|---|---|---|---|---|
1 | airbnb.com | 25,329,000 | 16,162,000 | 9,167,000 | 36.19% |
2 | marriott.com | 19,980,000 | 9,557,000 | 10,424,000 | 52.17% |
3 | vrbo.com | 13,097,000 | 7,097,000 | 6,000,000 | 45.81% |
4 | ihg.com | 10,156,000 | 4,564,000 | 5,592,000 | 55.06% |
5 | homeaway.com | 9,776,000 | 4,749,000 | 5,027,000 | 51.42% |
6 | choicehotels.com | 7,058,000 | 2,389,000 | 4,669,000 | 66.15% |
7 | trivago.com | 6,222,000 | 2,485,000 | 3,737,000 | 60.06% |
8 | starwoodhotels.com | 5,890,000 | 3,341,000 | 2,549,000 | 43.28% |
9 | hyatt.com | 4,487,000 | 2,513,000 | 1,974,000 | 43.99% |
10 | flipkey.com | 2,629,000 | 1,128,000 | 1,501,000 | 57.08% |
U.S. Mobile and Desktop Data – Feb 2016
The Takeaway: Airbnb had the most pages per visit at 12.26, with fellow vacation and short-term rental sites VRBO, HomeAway, and Flipkey in second through fourth place. Choice Hotels had the highest share of visitors coming via mobile as well as the lowest pages per visit at 3.46.
Top 10 UK Accommodations Booking Sites
# | Site | Combined Traffic | Desktop Traffic | Mobile Traffic | Mobile Share |
---|---|---|---|---|---|
1 | airbnb.co.uk | 6,295,000 | 4,010,000 | 2,285,000 | 36.30% |
2 | trivago.co.uk | 3,786,000 | 1,565,000 | 2,221,000 | 58.66% |
3 | premierinn.com | 3,206,000 | 1,375,000 | 1,830,000 | 57.10% |
4 | travelodge.co.uk | 2,478,000 | 1,000,000 | 1,477,000 | 59.63% |
5 | laterooms.com | 2,068,000 | 872,000 | 1,196,000 | 57.84% |
6 | holidaylettings.co.uk | 1,589,000 | 771,000 | 818,000 | 51.48% |
7 | secretescapes.com | 1,552,000 | 679,000 | 873,000 | 56.26% |
8 | ownersdirect.co.uk | 1,333,000 | 762,000 | 571,000 | 42.85% |
9 | homeaway.co.uk | 1,195,000 | 644,000 | 551,000 | 46.10% |
10 | ihg.com | 1,160,000 | 607,000 | 554,000 | 47.73% |
UK Mobile and Desktop Data – Feb 2016
The Takeaway: Airbnb again tops the list in number of visitors and, like the U.S., led with pages per visit, too. As in the U.S., a budget hotel operator was tops in mobile use, this time its homegrown Travelodge brand. The rest of the top 10 is a very UK brand-friendly list, with no international hotel chains based outside of the country making the list.
Top 10 India Accommodations Booking Sites
# | Site | Combined Traffic | Desktop Traffic | Mobile Traffic | Mobile Share |
---|---|---|---|---|---|
1 | oyorooms.com | 2,079,000 | 1,262,000 | 817,000 | 39.28% |
2 | trivago.in | 1,040,000 | 507,000 | 532,000 | 51.21% |
3 | agoda.com | 902,000 | 574,000 | 327,000 | 36.30% |
4 | airbnb.co.in | 743,000 | 564,000 | 179,000 | 24.12% |
5 | marriott.com | 326,000 | 204,000 | 122,000 | 37.40% |
6 | tajhotels.com | 278,000 | 186,000 | 92,000 | 33.08% |
7 | stayzilla.com | 276,000 | 164,000 | 112,000 | 40.55% |
8 | hotelscombined.com | 212,000 | 146,000 | 65,000 | 30.87% |
9 | couchsurfing.com | 203,000 | 147,000 | 57,000 | 27.82% |
10 | roomorama.com | 125,000 | 105,000 | 20,000 | 15.84% |
India Mobile and Desktop Data – Feb 2016
The Takeaway: With a nearly 2 to 1 edge over its nearest rival, newcomer Oyorooms beats out older, more traditional booking sites as well as older chains. Trivago, though, has the highest mobile usage of any brand.
This data is provided by Similarweb. Read more about Similarweb’s data and services on its blog.
Have a confidential tip for Skift? Get in touch
Tags: airbnb, similarweb, trivago
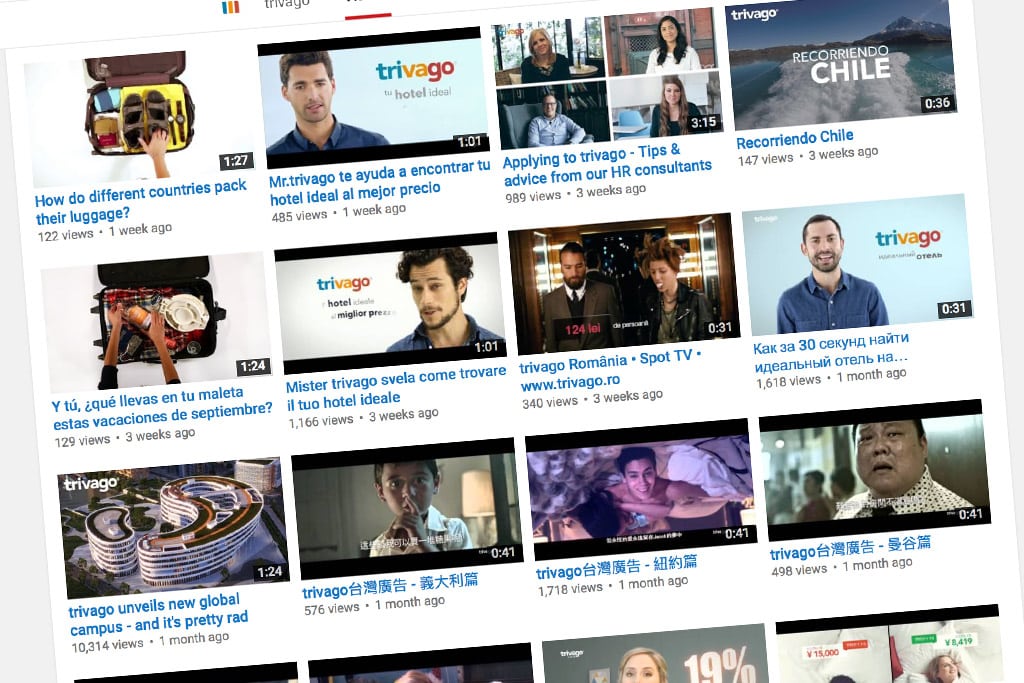
Photo credit: Trivago's aggressive advertising in multiple international markets give it a global edge where others fall short. Trivago