5 Charts That Show Where U.S. Hotels' Opportunities Are in 2015
Skift Take
Room demand and revenues this year have hit all-time highs at U.S. hotels, but deciphering how and why this happens is anything but simple.
STR, a hotel data company, said rising average daily rates will drive revenues the most this year as hotels wait for more properties to open to help year-over-year occupancy levels increase, even though overall occupancy is at 64.8%. U.S. average daily room rates are also higher this summer compared to a year ago and STR projects room rates will land 5% higher at end of 2015 than they were in December 2014.
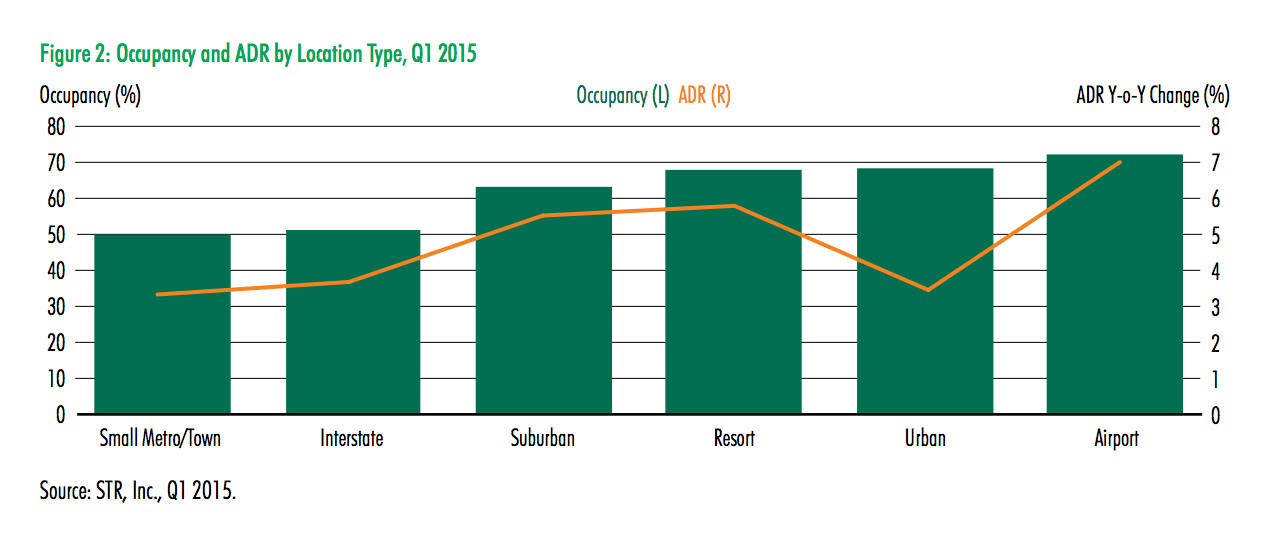
Along with luxury, midscale properties continue driving revenue more than other sectors and hotels such as Hilton have capitalized on this by announcing the launch of a new midscale brand. U.S. airport hotels are also apparently in high demand and in the first quarter 2015 drew the highest occupancy percentage and had the highest average daily rates compared to urban, resort or other suburban type properties. Denver International Airport, for example, realizes this trend and plans to open a 519-room Westin Hotel on its property later this year.
Below are five key charts highlighting the state of the U.S. hotel industry in 2015:
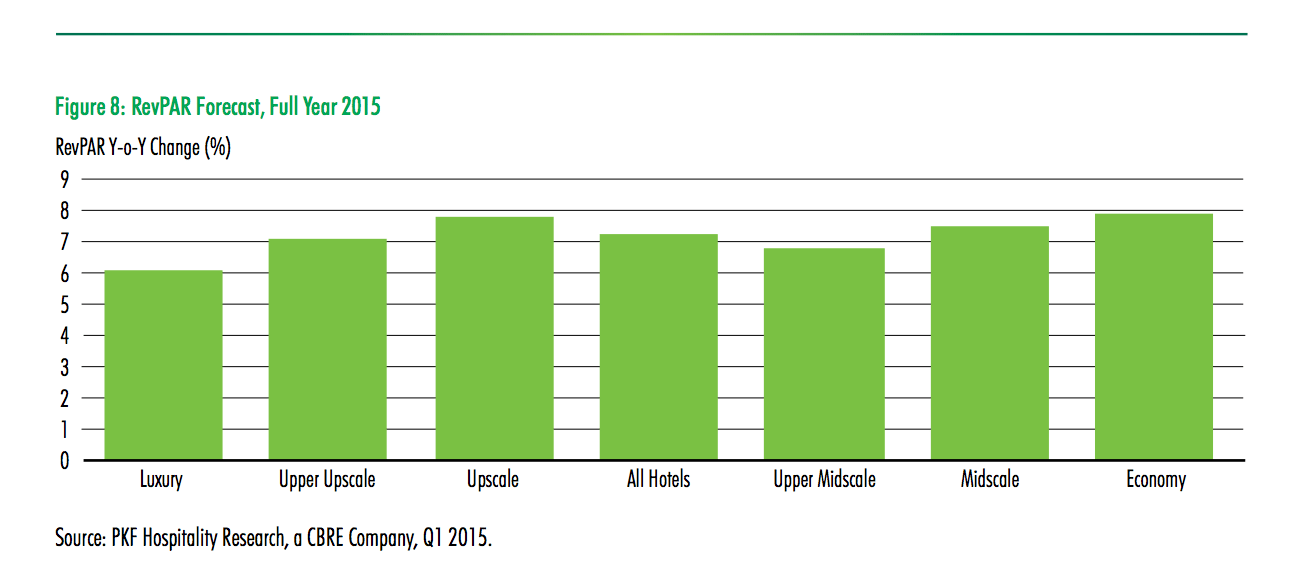
Chart 1: By year-end revenue per available room will be highest with upscale and economy hotels with the latter just slightly edging out upscale for the most revenue per available room.
Chart 2: By year-end the U.S. hotel occupancy percentage (66%) will be the highest when compared to the past three years and average daily rates and revenue per available room will also reach new highs.
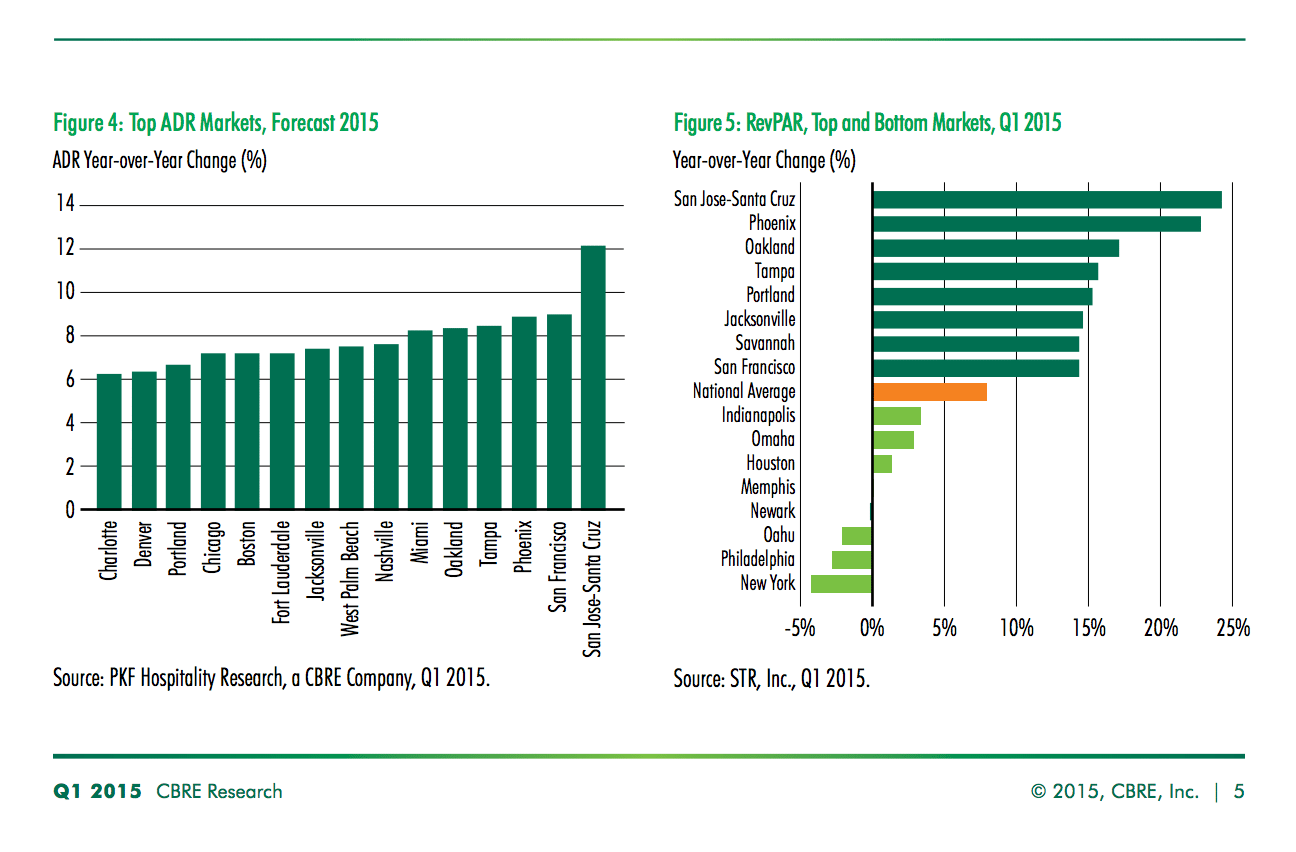
Chart 3: The Bay area will see the most growth in average daily rates this year and for the first quarter 2015 New York City hotels saw negative growth in revenue per available room.
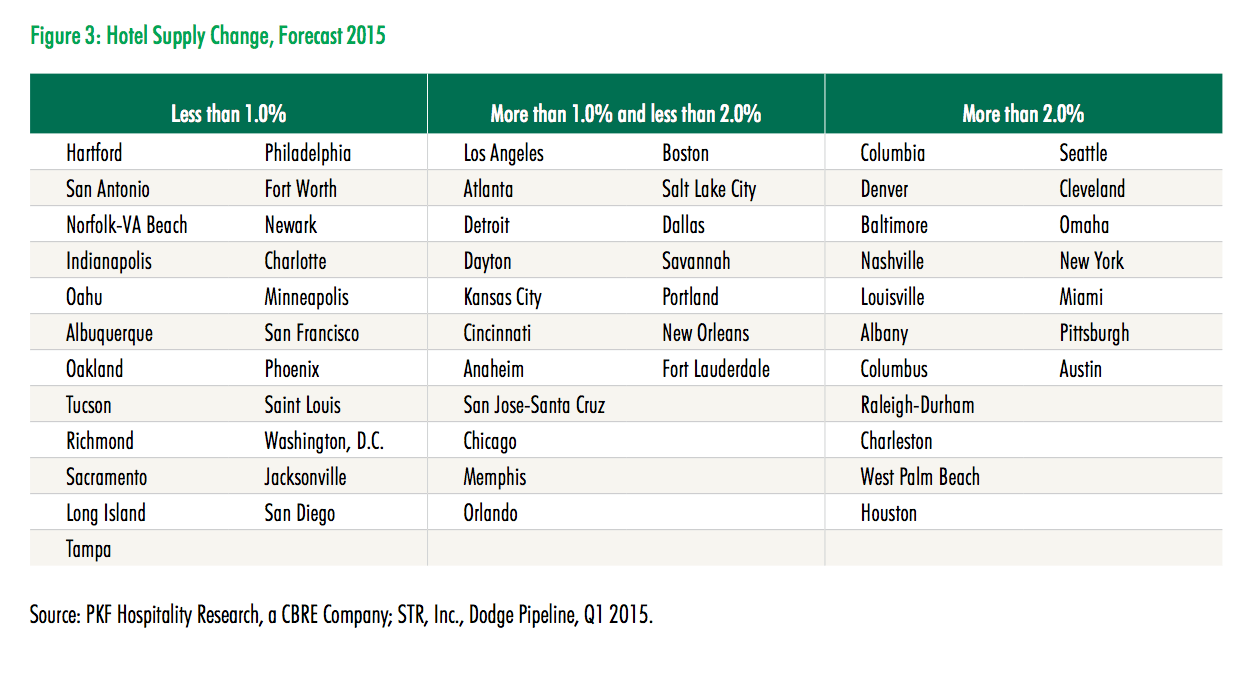
Chart 4: Mostly smaller, second-tier cities will see hotel supply change growth of less than 1% by year-end, major cities such as Los Angeles, Boston, Chicago and Dallas will see supply change growth between 1% and 2% and commerce and cultural capitals such as New York City, Nashville, Seattle and Houston will see growth of more than 2%.
Chart 5: Occupancy was highest at airport hotels in the first quarter 2015 and those hotels also saw the most year-over-year growth in average daily rates, with urban and resort hotels close behind.
