App Adds Data Visualizations to NYC Subway Maps
Skift Take
The iconic New York City subway map is designed to be quickly and easily understood by locals and visitors alike, but each colored line and black station dot represents the primary transport system of millions of people each day.
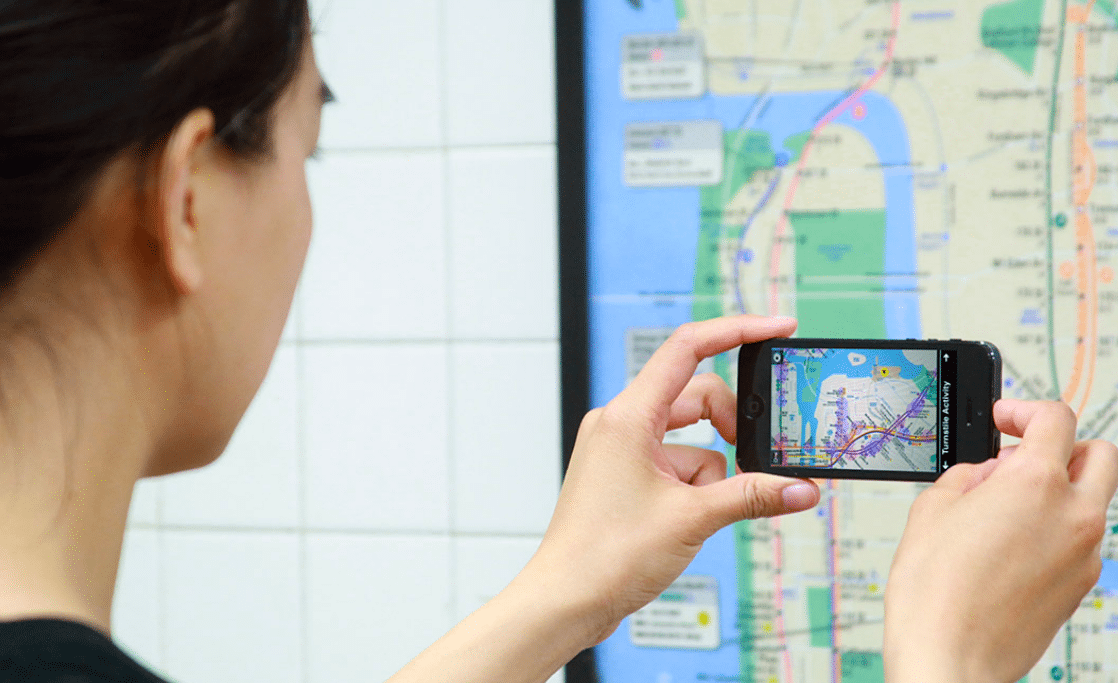
To add context to the stylistically simple maps, a new app called Tunnel Vision highlights neighborhood and transit data through interactive visualizations.
Users can open the app and point it at an actual subway map to see the data come to life. They can then access MTA data to see where trains are moving in close to real-time and at which stations the highest volume of people are entering and exiting turnstiles.
Users can also access U.S. Census data to learn about the median incomes, rent, and population density in each neighborhood.
The app is one example of the tools that can be created with greater access to open data.
All of the interactions on the app are made possible with open data released by the MTA and U.S. Census Bureau. We recently wrote about the perfect business travel tool of the future that would only be possible with even greater access to open data.
Although still a long way off from that seamless trip planning tool, Tunnel Vision highlights how existing data can still be used to enrich and inform during the travel experience.
The app's release coincidently coincides with the passing of designer Massimo Vignelli who worked with the MTA throughout his career and most recently designed the MTA’s Weekender app for iPhone and Android.
The app was created by Bill Lindmeier as a thesis project at NYU graduate program ITP. It is now available on iTunes.