7 Charts That Show the Health of U.S. Travel Economy in 2015 and Beyond

Skift Take
The state of the United States travel economy is healthy in 2015.
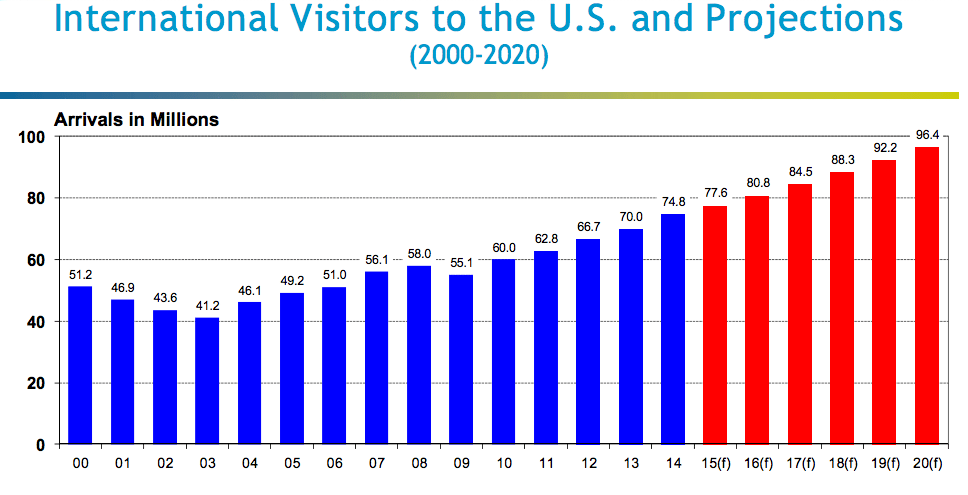
The travel and tourism sector in the U.S. made up for 2.6 percent of GDP—7.8 million jobs and $1.5 trillion in travel and tourism total sales in 2014—and has recovered well from the dual shocks in this century of post-9/11 slump and the severe financial crisis of 2007-2008.
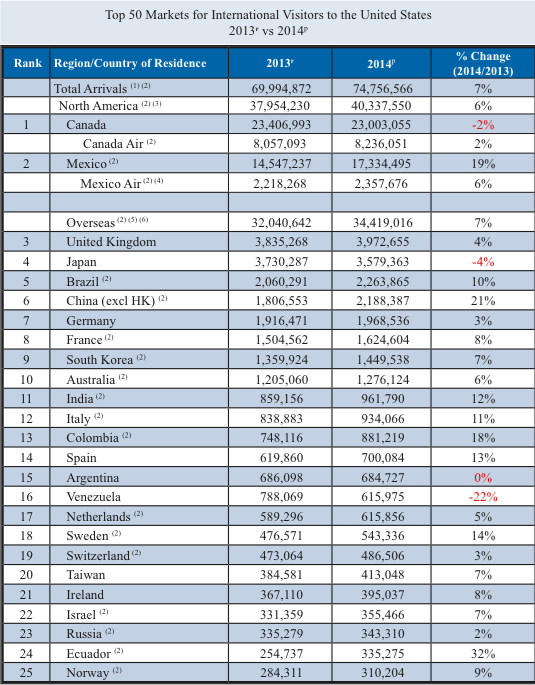
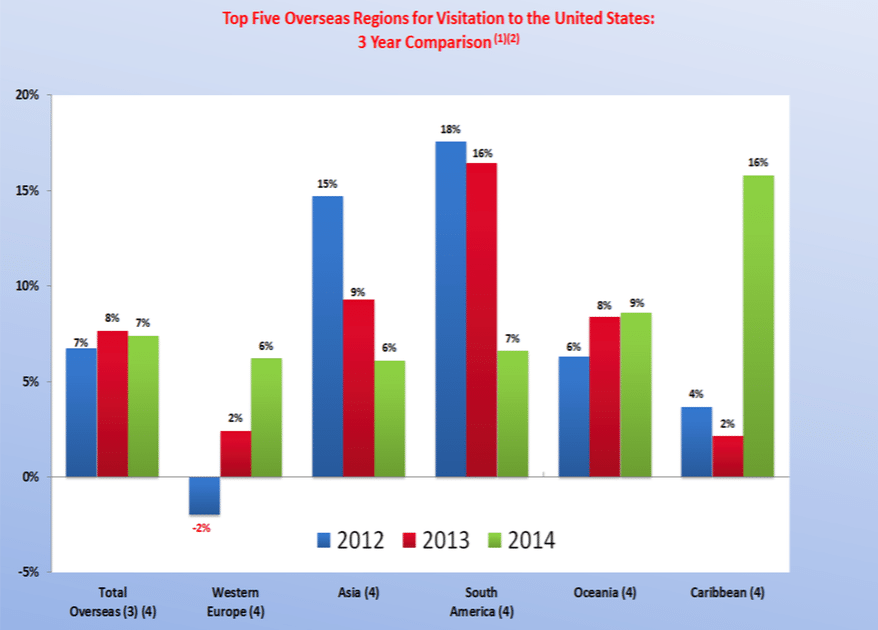
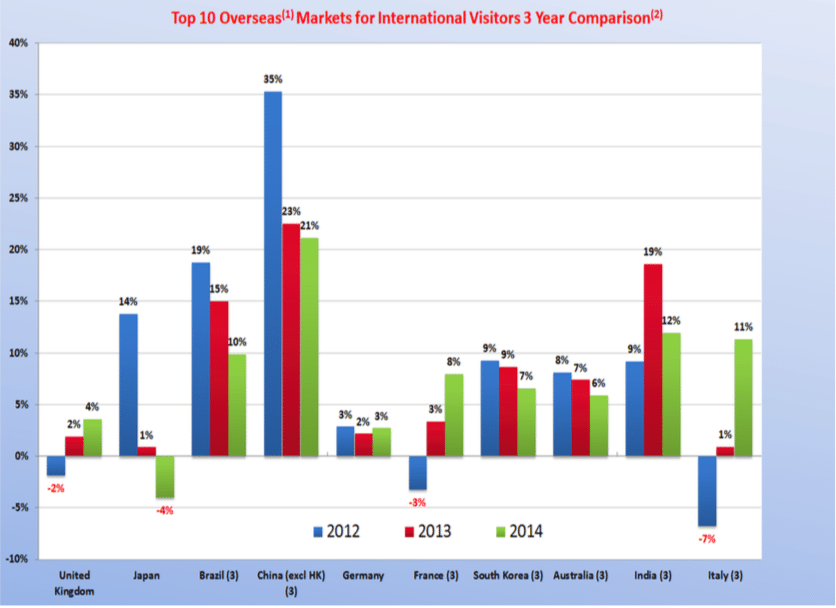
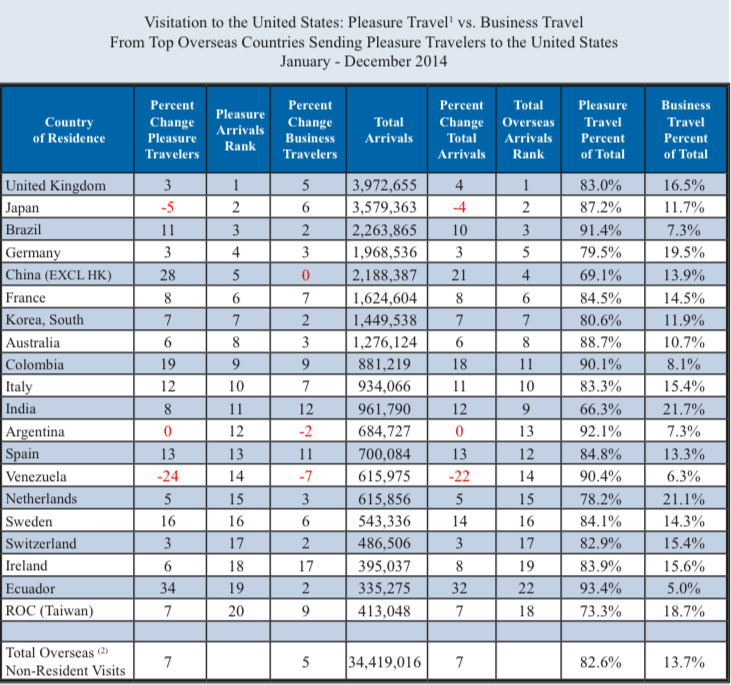
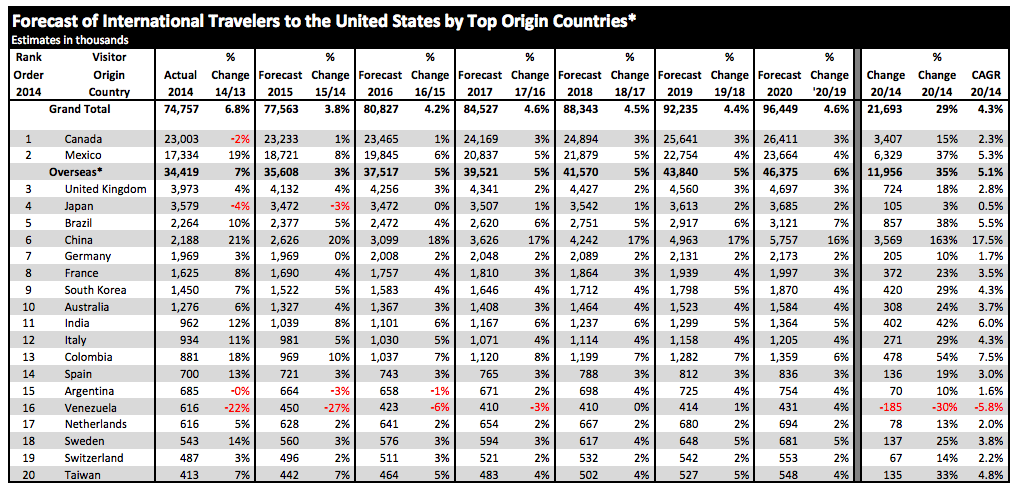
The U.S. welcomed nearly 75 million international visitors in 2014, five million more than the year before and a seven percent increase over 2013, according to latest data from National Travel and Tourism Office, part of the U.S. Department of Commerce. The result is a fifth consecutive record for total arrivals to the United States, as every major region recorded year over year increases and set visitation records. The majority of the major markets also recorded year over year increases, with the exception of Canada, Japan, Argentina, and Venezuela.
With a dominant 14.2 percent share of world traveler spending—well ahead of Spain and France, and 6.6 percent share of world travelers, second only to France, the U.S. travel economy is mirroring the general health of the overall economy, and shows why international travel into U.S. is so important. And why so much more needs to be done on making it easier for the world to come to visit America, from a policy, infrastructure, and experience perspective.
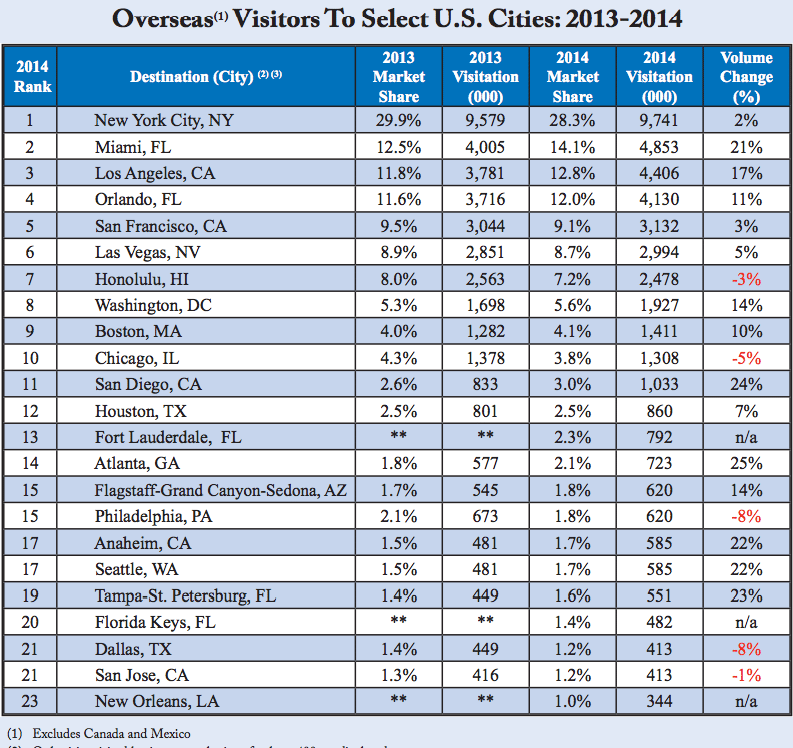
Below, we have selected seven charts from the latest 2014 tourism numbers released earlier this month by U.S. Dept of Commerce. These charts show the health of the U.S.'s overall travel and tourism economy and the trends of which countries and regions may provide the future generators of those billions (and even trillions) of dollars of spend to come.
Click on each of chart to get a larger version.
Some other interesting traveler characteristics in the latest data that is worth noting here:
- The average number of states visited in 2014 increased from 1.4 to 1.5 and the percentage of travelers visiting only one state increased to a 73 percent share of total visitors, up slightly in 2014. The average number of destinations visited increased from 1.9 to 2.0 and the percent of travelers visiting only one destination dropped two percentage points to 54 percent.
- The length of stay in the United States averaged 18.4 nights, up from 17.5 nights in 2013. Several of the top overseas arrival markets showed increases in the length of visit, i.e. the U.K, Japan, China, Germany, Korea and Italy among the top 10 overseas arrivals markets.
- The travel party size increased from 1.6 to 1.7. For Asian and European travelers, however, the average party size held constant year over year.
- The usage of a ‘conventional’ tour package (including at minimum both air and lodging), estimated at 5.9 million, increased slightly in 2014. The share of all travelers using a package declined to 17.1 percent from 18.1 percent in 2013. The use of tour packages declined in the Asian markets. Consequently, the number of independent travelers increased in 2013.
- First time travelers to the United States, as a share of all travelers, increased slightly from 23.7 in 2013 to 23.8 percent in 2014. Repeat travelers, consequently decreased slightly as a share but increased seven percent. ‘Repeat’ visitors characteristically venture beyond the top destinations.
- Transportation usage in United States increased for each of the modes tracked except air travel between U.S. cities. Cruise, Ship/River Boat, for one or more nights, increased 18 percent. Auto usage, both rental and private/company, increased by double digits.

