
In 2019, tourism contributed about 11 percent of global greenhouse gas emissions. The tourism sector is highly vulnerable to climate change and at the same time contributes to the emission of greenhouse gases (GHGs). If the negative impact of tourism on the environment is not fixed, it will not only impact the success of the tourism industry but threaten human survival fundamentally.
In Skift Research’s latest report, we attempt to demystify the assumption that tourism is a ‘low Impact and non-consumptive development option’ by estimating the amount of carbon emitted because of tourism-related activities in select 25 countries. On the back of secondary research and interactions with three senior industry professionals, we also highlight the fact that to date GHG emissions from tourism at a destination level are largely unaccounted for.
To quantify emissions at a destination level, we calculated the ‘Tourist Emission Factor’ by correlating tourist emissions with inhabitant emissions. As this approach only accounts for the on-shore emissions, we also included emissions for air transport in our final data.
Last week, we published our latest Skift Research report, Sustainability in Travel 2021: Quantifying Tourism Emissions for Destinations. Below, we share a snippet of the report.
International tourists visiting emerging economies emit more than the inhabitants on a per capita basis while the opposite trend is seen in advanced economies.
Skift Research
Average international tourist emission factor for countries with low GNI per capita/emerging economies is 3, meaning that international travelers to these countries emit more than three times as much as a local. The international emission factor is the highest in countries like Thailand, India, Indonesia and Philippines.
In such countries the GNI per capita and hence, the household expenditure per capita is much lower than the international tourist spend per day, translating into higher per capita international tourist emissions as compared to an average inhabitant’s emissions. The reverse happens in advanced economies like the U.S., Canada and France, where the international tourist emission factor is less than 1.
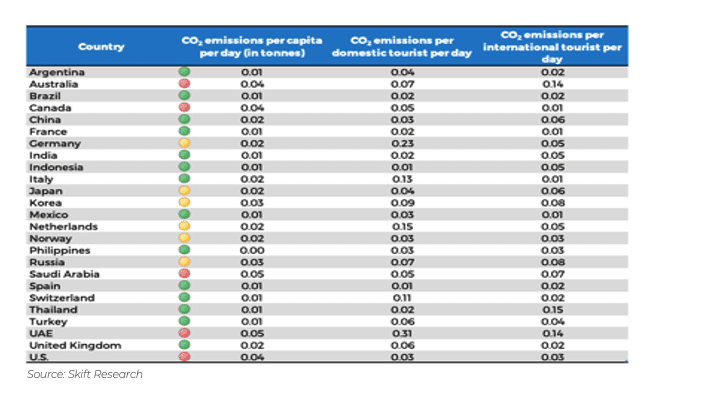
For example, foreigners visiting countries like Thailand tend to spend lavishly on luxurious amenities, using more resources than an average inhabitant. The household expenditure per capita per day in Thailand is $13 while an international tourist spends around $206 in a day.
In the U.S., the household expenditure per capita per day is $121 while an international tourist spends around $99 in a day.
As per the stats provided by our data partner STR, out of the total number of hotels in the U.S., only 20 percent fall in the luxury, upper upscale and upscale categories while 40% of hotels in Thailand fall in this category. Considering this as a proxy to the tourist expenditure trend, it is clear that tourists prefer to spend more on luxury in cheaper countries like Thailand, and less in expensive countries like the U.S., justifying the difference in their emission factors. As discussed in our report Sustainability in Travel 2021: Emissions Benchmark of Six Global Hotel Companies, luxury hotels have higher emissions per room than midscale or economy hotels.
Exhibit 12: Domestic and international tourist emission factor
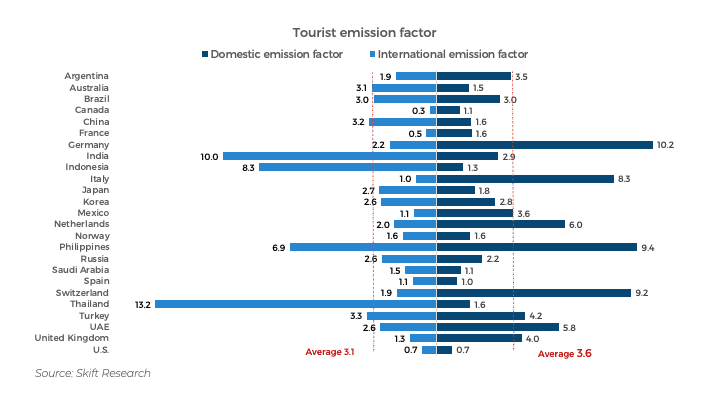
Domestic visitors in European countries seem to emit more than the inhabitants on a per capita basis.
Domestic visitors in the United Kingdom and European countries like Germany, Italy, the Netherlands, and Switzerland seem to emit more than an average inhabitant.
The common theme across these countries is that they have a high percentage of same-day visitors. Since the same-day visitors have not been accounted for in our study, the skewed domestic tourist numbers drive up the average domestic tourists daily spend and hence the emission factor.
The domestic emission factor for the United Arab Emirates (UAE), Philippines, and Turkey are also above average.
Exhibit 13: Tourist emissions on per capita basis

This is the latest in a series of reports and data products that Skift Research puts out to help you understand the trends in the travel industry. Tap into the opinions and insights of our seasoned network of staffers and contributors. Over 200 hours of desk research, data collection, and/or analysis goes into each report.
After you subscribe, you will gain access to our entire vault of reports conducted on topics ranging from technology to marketing strategy to deep dives on key travel brands. You will also be able to access our proprietary Skift Recovery Index and Skift Health Score data and reports.
Subscribe to Skift Pro to get unlimited access to stories like these
{{monthly_count}} of {{monthly_limit}} Free Stories Read
Subscribe NowAlready a member? Sign in here
Subscribe to Skift Pro to get unlimited access to stories like these
Your story count resets on {{monthly_reset}}
Already a member? Sign in here
Subscribe to Skift Pro to get unlimited access to stories like these
Already a member? Sign in here