This new chart from U.S.’s National Travel and Tourism Office captures what all of the U.S. travel industry went through in its worst year in modern history. Interestingly, there was still some demand in U.S., unlike other stricter-restriction countries, which kept many parts of the industry at subsistence-enough level that it survived. As expected looking back, it was international cross-border travel that suffered the most, but domestic/backyard travel kept leisure travel going, particularly starting summer of 2020.
Some other data from NTTO:
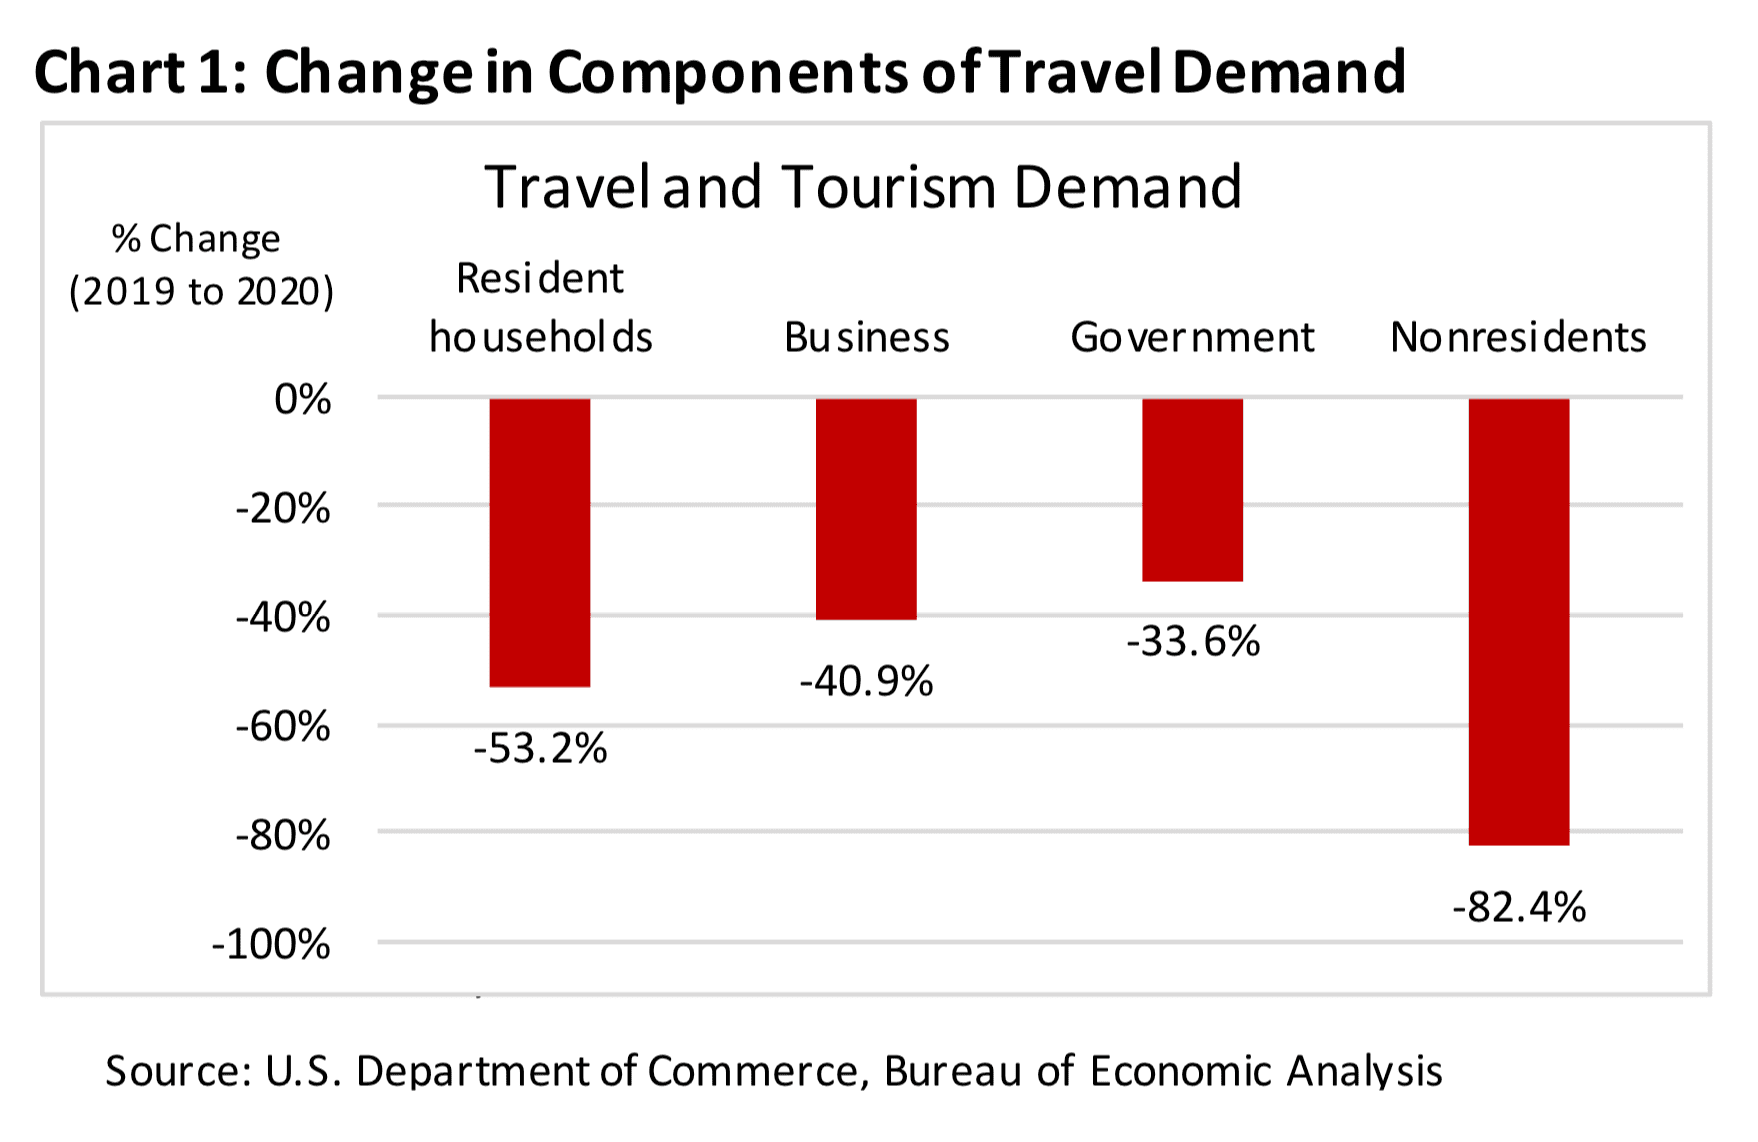
Because travel demand by nonresidents declined much more than domestic demand for travel in 2020, nonresidents’ share of travel demand in the United States fell from 13.5% in 2019 to 5.1% in 2020. As a result, the various domestic components’ share of travel demand increased in 2020 (see chart below).

The 8.4%-point decline in nonresidents’ share of travel demand was the largest annual decline since the TTSA began in 1998. It was more than fourtimes greater than the next-largest annual decline that occurred in 2001, when nonresidents’ share of travel demand declined to 12.6% from the 2000 level of 14.4%, a drop of 1.9%-points.