Skift Take
The increased spending in areas outside of retail and other traditional expenses is a good indicator of how international travelers in the U.S. are prioritizing their spending as we get deeper into 2017.
International visitors to the United States spent more in 2016 than they did in 2015, despite the strength of the U.S. dollar against many foreign currencies and a slowing of international visitors.
The $247.1 billion international travelers spent in the U.S. last year is a 0.4 percent increase from the $246.2 billion they spent in 2015, according to data from the U.S. National Travel and Tourism Office.
This growth comes despite the stagnating growth of international arrivals to the U.S. throughout 2016, and as international visitors spent more than $2 billion less on airfares in 2016 than they did the year before (a 5.9 percent decrease).
Slower spending growth shouldn’t be a surprise as about 0.9 percent fewer visitors were forecast to visit the U.S. last year compared to a record 77.5 million visitors in 2015, according to a Department of Commerce forecast made in November.
Official international visitor totals are expected next month but if the forecast is realized 2016 would be the first year since 2009 to post a decrease in foreign visitors. The Department of Commerce expects better news in 2017 — a 2.4 percent increase in foreign visitors for a new record of 78.6 million visitors. That’s all dependent on the Trump Administration’s immigration and visa policies, however, which remain uncertain or are still unfolding.
In contrast, Americans spent about $158.9 billion on international travel last year.
Lower spending on airfare was the greatest factor that prevented overall spending growth, but only U.S. carriers are included in this data. A U.S. Department of Commerce report from earlier this month, however, found that foreign carriers gained market share in the U.S. in 2016 and are increasingly flying U.S. and international travelers to and from the U.S.
Airfare wasn’t the only category where spending was down — in-destination spending was also down 1.5 percent year-over-year for categories such as lodging, food, souvenirs, entertainment, and local transportation.
Visitor spending was weakest during the busy summer travel season from May through September. Spending receipts were down year-over-year between April to July and August had zero percent growth. June’s receipts, for example, were down four percent from June 2015.
One bright spot: Medical and education-related tourism was up by nearly 12 percent year-over-year and international travelers spent some $53.2 billion on wellness experiences, medical procedures, and tuition and fees for foreign students studying at American universities. This category had the largest year-over-year increase among the categories (see below) the U.S. National Travel and Tourism Office breaks out, including international travelers’ receipts for lodging, food and airfare.
International Visitor Spending in the U.S. in 2016 ($ Billions)
| International Traveler Receipts in U.S. | 2015 | 2016 | Year-Over-Year Change |
|---|---|---|---|
| Passenger Fare Receipts** | $41,704 | $39,258 | -5.9% |
| Travel Receipts | $204,524 | $207,867 | 1.6% |
| -Travel Spending | $156,982 | $154,646 | -1.5% |
| -Medical/Education/Workers Spending | $47,542 | $53,221 | 11.9% |
| Total Travel and Tourism-Related Exports* | $246,228 | $247,125 | 0.4% |
*Includes Travel Receipts and Passenger Fare Receipts
**Only U.S. carriers are included in this data.
Source: U.S. National Travel and Tourism Office
The Daily Newsletter
Our daily coverage of the global travel industry. Written by editors and analysts from across Skift’s brands.
Have a confidential tip for Skift? Get in touch
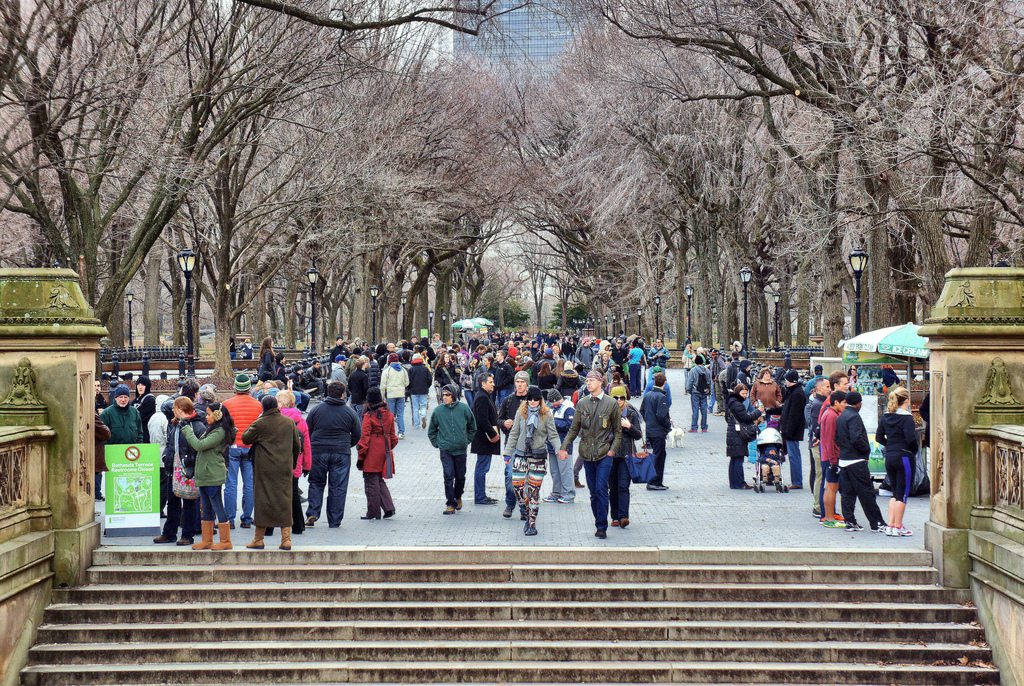
Photo credit: International travel spending in the U.S. barely grew last year. Pictured are tourists in Central Park in New York City. PRORegan Vercruysse / Flickr
