Skift Take
U.S. business travelers' high satisfaction stems from not spending their own money and knowing where to go and what to avoid in a destination. Leisure travelers aren't far behind with their satisfaction but this should still concern destinations, especially those where business travel is their bread and butter, given business travelers also spend more in categories like lodging, shopping, and transportation than the tourists they have to share their trips with.
Business travelers enjoying their destinations, be it through sightseeing or souvenir shopping, is a trend as old as business travel itself.
And U.S. business travelers, it turns out, are more satisfied with their destinations than leisure travelers and in some cases spend more than the latter during their trips.
That’s according to market research company JD Power and Associates‘ new study on travelers’ satisfaction toward their destinations, and how that impacts factors such as in-destination spending, the likelihood of recommendations to friends, or reasons for visiting or returning. Respondents that said they traveled to a destination for business reasons enjoyed their trip slightly more than those who travel for leisure (806 vs. 795, respectively, on the company’s 1,000-point scale).
JD Power conducted the online survey between February and July 2016 and it includes more than 26,000 respondents who are age 18 and older, live in the U.S., and traveled to a top 50 U.S. destination more than 50 miles from their home during the previous 60 days. STR, a hotel data company, determined the top 50 U.S. destinations by number of hotel room nights sold. Data represents trips taken between December 2015 and July 2016. Satisfaction was broken down across destinations in five U.S. regions: Northeast/Mid-Atlantic, Southwest, South, Midwest, and West. Respondents included both business and leisure travelers and they weren’t segmented based on income levels.
Business travelers have many reasons to feel more satisfied with their trips even if their meetings or business don’t go well. “A big part of this is cost and fees,” said Rick Garlick, JD Power’s global head of travel research. “I’ve also found that traveling with colleagues, for example, is unfettered with concerns of shepherding your spouse and children.”
Of course, business travelers aren’t paying for their travel (even if their spending is restricted) and are generally more familiar with a city and what to expect if they’ve visited multiple times. That leaves a 34-point difference in satisfaction in the cost and fees factor between business travelers and leisure travelers (770 vs. 736, respectively, on a 1,000-point scale).
All five regions were more satisfying to business travelers than their leisure counterparts and only activities, lodging, and food and beverage indexed higher for satisfaction among leisure travelers (the latter two categories by only one point).
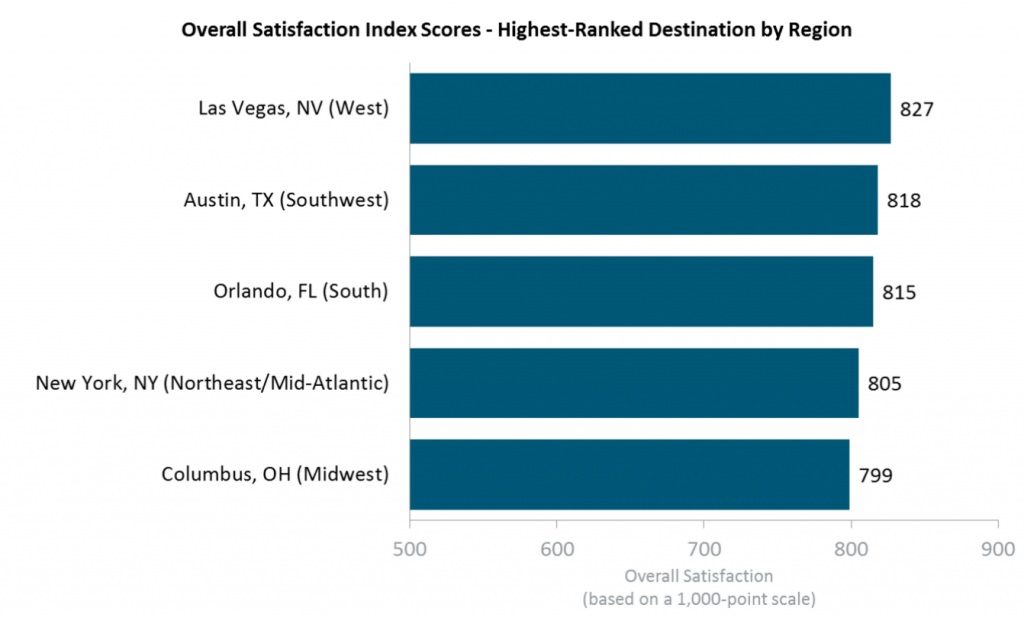
For all travelers, Las Vegas has the highest index score for satisfaction of any U.S. city included in the study (the highest ranked cities are listed in the chart below). “Despite the proclivity of many Americans to unintentionally leave quite a bit of money behind, it also ranks highest in the cost and fees factor,” the study points out. “Las Vegas outperforms overall second-ranked Oahu Island (813) by 14 points.”
There were a few surprises in the overall ranking, said Garlick. Orlando, Florida, for example, likely owes much of its high ranking to nearby theme parks and attractions rather than the city proper. “Austin, Texas really surprised me for how well it scored, almost 50 percent of respondents who visited Austin said they are ‘highly emotionally attached’ to the city,” he said. “The other city that surprised me was Columbus, Ohio which respondents gave the highest food and beverage satisfaction rating to for a midwestern city. You have to remember that Chicago, for example, is also in the midwest and this finding really struck me.”
Nearly 95 percent of respondents also said they feel safe when traveling around the U.S. “People hear about some of the horrible events that have taken place recently on the news and they often over-exaggerate and think that the U.S. is dangerous when there has only been a relatively small number of these events,” said Garlick. “It’s great to see that travelers still feel safe. When you compare those numbers with how safe U.S. travelers feel about traveling outside the U.S. it’s a pretty stark difference.”
Spending to Satisfaction
The charts below show differences in satisfaction between business and leisure travelers and also highlight satisfaction levels based on dollars spent.
Chart 1: Business travelers are more satisfied with their trips across virtually every category except activities and they’re neck-in-neck with leisure travelers for satisfaction with lodging and food and beverage.
Although travel agents were one of the least used booking methods (only seven percent of respondents said a travel agent booked their trip) trips booked by travel agents indexed the highest for satisfaction, more than any other booking method. Using a booking site was the most popular method (28% of respondents) but booking sites had one of the lowest index rankings for satisfaction.
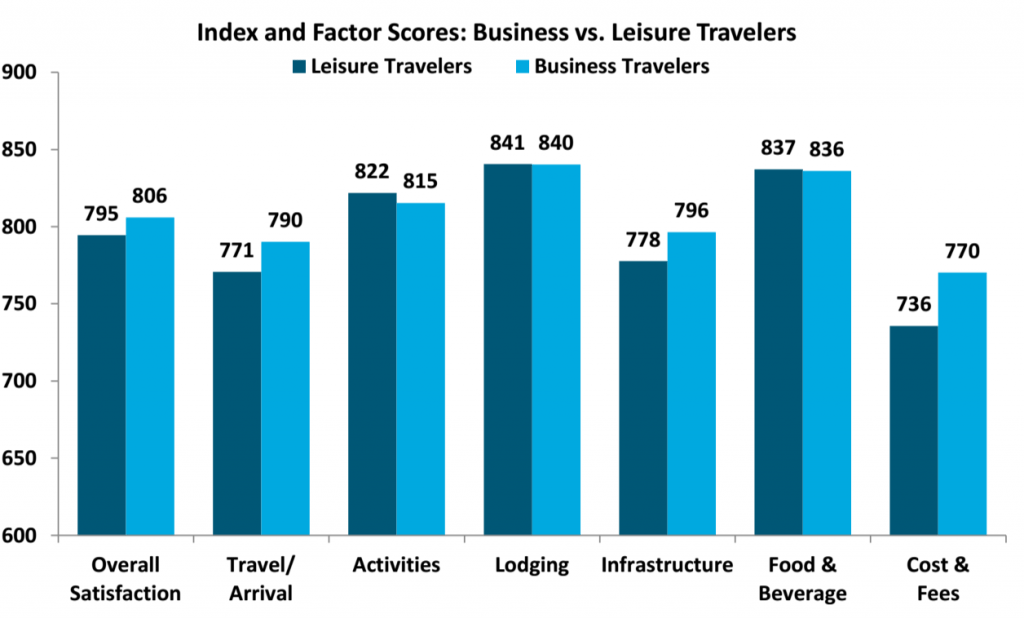
Chart 2: Every U.S. region was more satisfying to business travelers than those traveling for leisure with the U.S. south and southwest indexing higher than other regions.
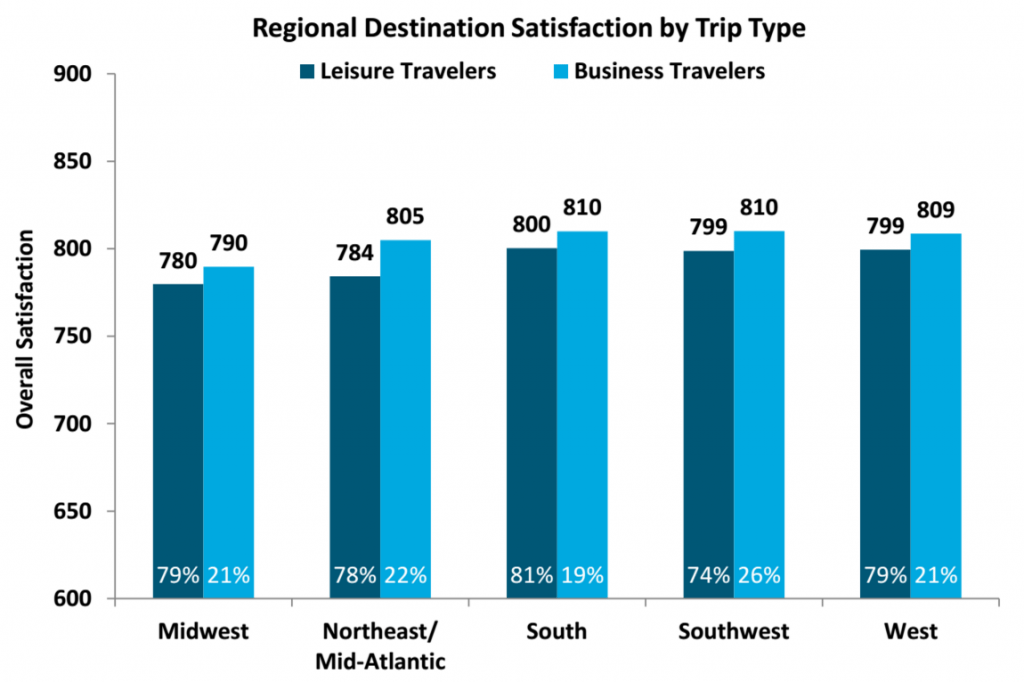
Chart 3: Business travelers spend nearly has much on lodging per day as leisure travelers, a notable finding given business travelers typically pay negotiated hotel rates sometimes lower than the standard nightly room rate. Business respondents also said they spent more on average per day on shopping and transportation and nearly as much as leisure travelers on food and beverage.
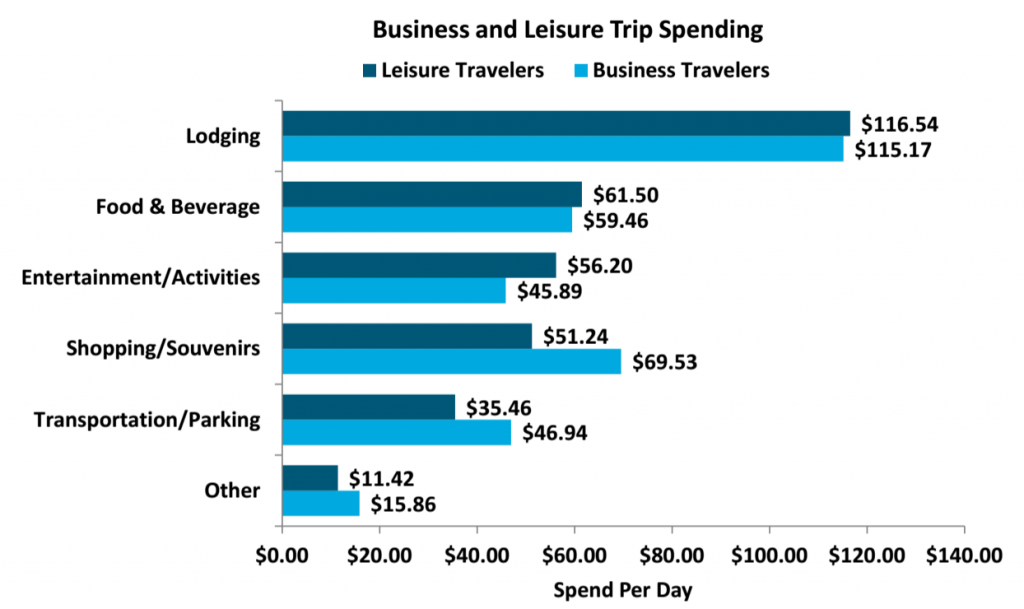
Chart 4: Money can buy happiness, at least based on the findings in this study. Respondents that said they were “delighted” with their trip spent the most ($1,445.70), some $252 more than those who were “pleased” and about $500 more than respondents who were “disappointed” or “indifferent.”
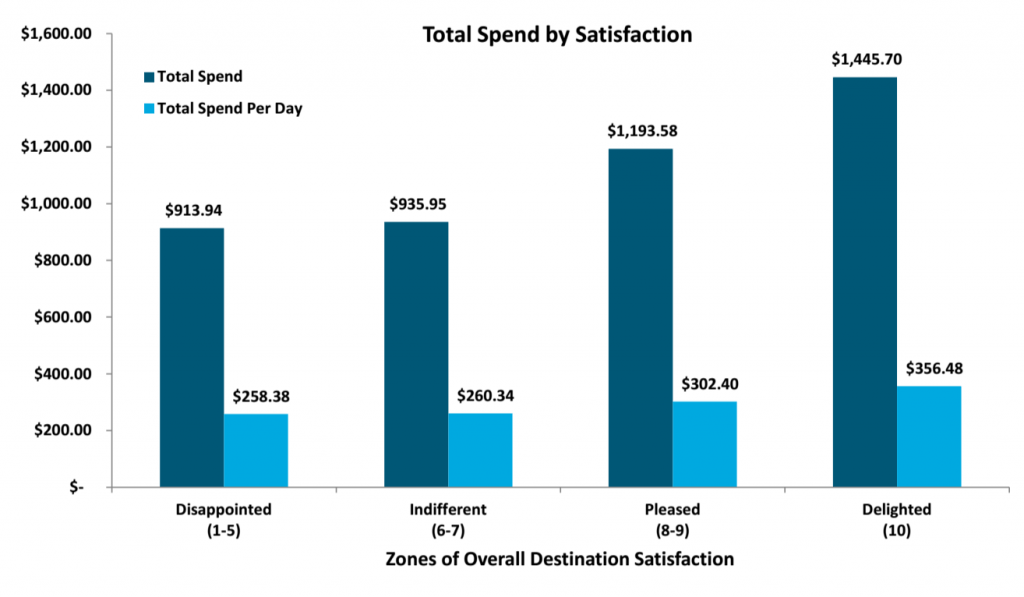
Chart 5: The U.S. south and southwest are the most satisfying regions to travelers and the midwest is the least satisfying. Green denotes the highest index score and red denotes the lowest for each category.
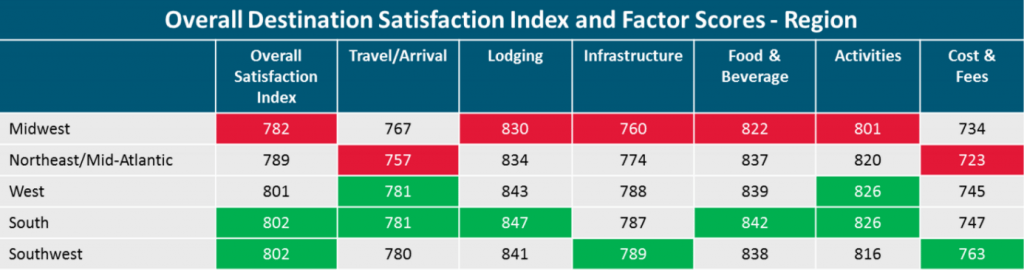
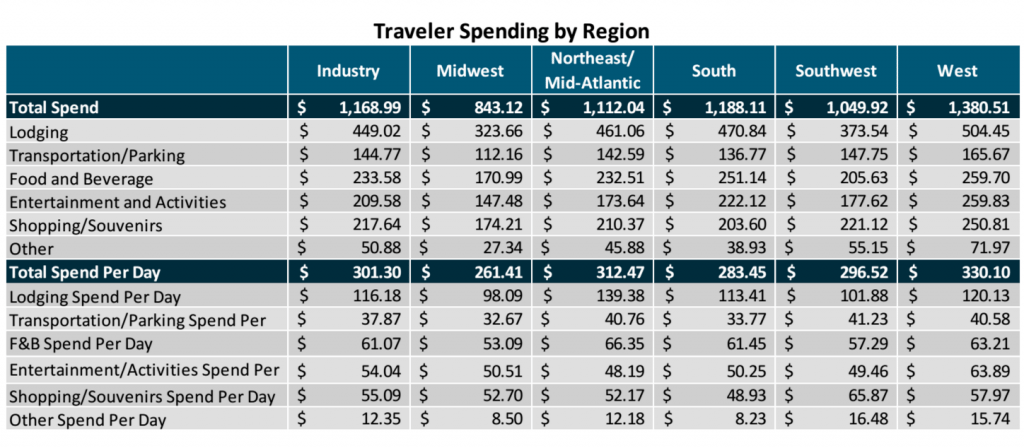
Chart 6: Travelers spend the most on trips in destinations in the U.S. west such as California, Colorado and Utah.
Respondents spent the most on lodging in the west ($504.45), the south ($470.84) and the northeast/mid-atlantic ($461.06). But respondents that visited a northeast or mid-atlantic destination spent $19 more per day on lodging on average than those that visited destinations in the west.
Source: JD Power and Associates and Smith Travel Research
The Daily Newsletter
Our daily coverage of the global travel industry. Written by editors and analysts from across Skift’s brands.
Have a confidential tip for Skift? Get in touch
Photo credit: Business travelers are more satisfied than leisure travelers with their trips across most U.S. destinations. Pictured is the Bellagio hotel and casino in Las Vegas, the top ranked U.S. destination for overall satisfaction. John Locher / Associated Press