Skift Take
We're looking forward to the end of March, when Airbnb and the New York State Attorney General square off in court.
Earlier this month Skift took a deep data dive into Airbnb’s listings in New York City, in what was the first instance of a third-party taking a data-driven look at how hosts and guests interact on the site.
Our first story looked at the most popular types of listings on the site and found that while shared spaces represented only 2% of listings and private rooms 42%, listings for entire apartments made up 66% of active listings on the site. The second story looked at eleven hosts in the city that had listings to their name in the double-digits.
One conclusion from both stories is that Airbnb still relies on the type of short-term rentals that the state of New York has deemed illegal, and that leases, co-ops, and condo boards restrict. They’re also the target of a probe by the New York State Attorney General.
But it also noted that the most popular neighborhoods were ones in which few hotels do business.
Listings Landscape
Unlike rooms sold by hotels, visitors are as likely to find a listing on Airbnb in some residential neighborhoods in Brooklyn or Queens as they are to find one in Midtown Manhattan. Much like the residents that make up the city, the listings on Airbnb are diverse, disparate, and at income levels that range from a sub-$30 shared bedroom in Bed-Stuy, to a $10,000 a night mansion on the Upper East Side.
Exactly how many are in New York is not clear. On the main New York neighborhoods page, Airbnb states that there are 34,257 listings. After diving into the website on multiple occasions in December and January, our partner Connotate never found more than 19,600, just a little more than half of what Airbnb claims it has in the city.
The discrepancy is present on Airbnb, too. Take Soho, for instance. The neighborhood page promotes the listings with the line “See 1,135 places to stay,” but when you follow the prompt and begin an open search, there are 280 listings to choose from. The discrepancy was extreme in the case of Soho, but the number on the neighborhood page is always considerably higher than it is when a user begins a search.
Airbnb has not responded to questions seeking to clarify which of these numbers is correct. It claimed in December that it had 550,000 listings worldwide.
Listings Vs. Reviews
One of the leading reasons why Airbnb saw such rapid success is that it demystified the process of renting a place from a stranger. By integrating Facebook’s social graph and then verified identities, it gave users assurance that their host, or their guest, was likely not a creepy loner. The very low rate of incidents between hosts and guests has demonstrated this works rather well.
The second half of this is reviews by guests and hosts. They make users feel safe about sleeping in a strangers place, and allow both sides of the transaction to rate one another. Listings with multiple reviews are a good barometer for rental activity on a listing.
While we’ve added up the number of listings per neighborhood, below, we’ve also looked at which neighborhoods appear to be most active based upon user reviews. This allows us to see that while Alphabet City may not have as many reviews as the Upper East Side, more users are writing reviews on their stay in that neighborhood. It also tells us that Harlem, which is one of the five leading Airbnb neighborhoods by listing volume, is also one of the most popular by number of reviews.
It also tells us that Morningside Heights is no user favorite.
12 Most Popular by Percentage of Listings With Reviews
| Neighborhood | Number of Listings | Listings With Reviews | Percentage of Listings With Reviews |
|---|---|---|---|
| Alphabet City | 447 | 355 | 79% |
| Red Hook | 33 | 26 | 79% |
| Cobble Hill | 30 | 23 | 77% |
| Noho | 60 | 46 | 77% |
| Harlem | 978 | 741 | 76% |
| Flushing | 38 | 28 | 74% |
| Midtown | 570 | 414 | 73% |
| Brooklyn Heights | 102 | 74 | 73% |
| Lower East Side | 726 | 524 | 72% |
| East Village | 659 | 474 | 72% |
| Fort Greene | 215 | 155 | 72% |
| Soho | 229 | 166 | 72% |
10 Least Popular by Percentage of Listings With Reviews
| Neighborhood | Number of Listings | Listings With Reviews | Percentage of Listings With Reviews |
|---|---|---|---|
| Morningside Heights | 93 | 33 | 35% |
| Midtown East | 347 | 136 | 39% |
| Battery Park City | 100 | 40 | 40% |
| Financial District | 353 | 166 | 47% |
| Kips Bay | 419 | 219 | 52% |
| Windsor Terrace | 59 | 31 | 53% |
| Washington Heights | 392 | 214 | 55% |
| Tribeca | 171 | 83 | 49% |
| Civic Center | 25 | 14 | 56% |
| Flatiron District | 254 | 147 | 58% |
| Upper East Side | 1,091 | 668 | 61% |
| Gramercy Park | 228 | 140 | 61% |
Source: Skift/Connotate
All the Neighborhoods
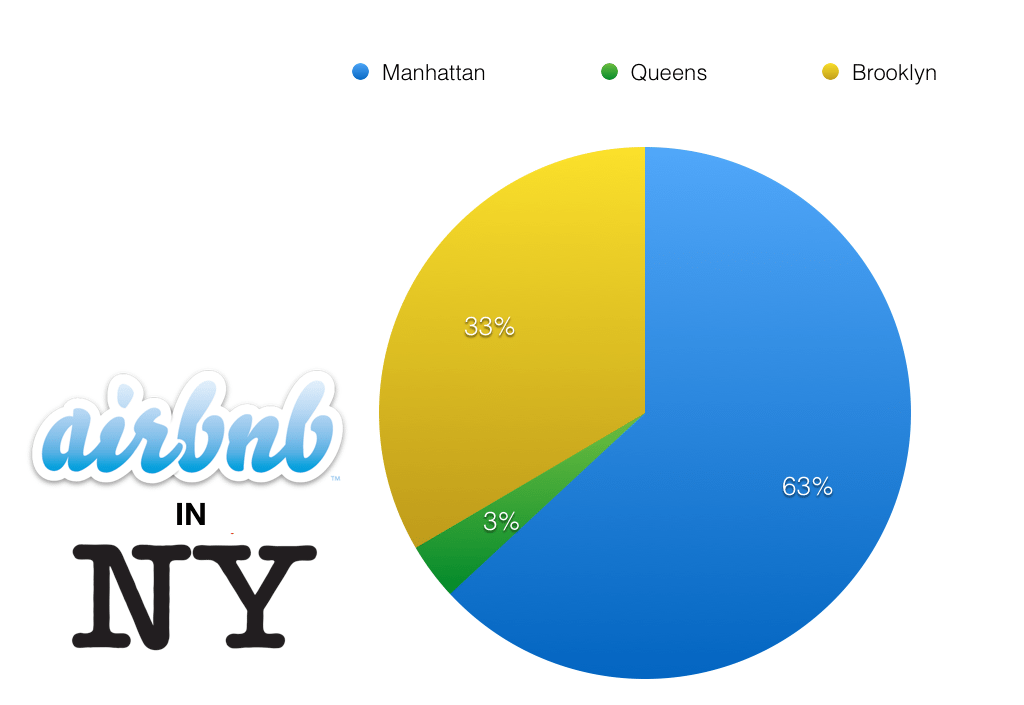
Below is our compilation of listing information by neighborhood and borough. We can see that Manhattan is easily the largest neighborhood by sheer numbers, followed by Brooklyn and Queens.
Queens
| Neighborhood | Number of listings | Listings with reviews |
|---|---|---|
| Astoria | 402 | 252 |
| Long Island City | 90 | 60 |
| Ridgewood | 82 | 54 |
| Jackson Heights | 61 | 38 |
| Flushing | 38 | 28 |
Source: Skift/Connotate
Brooklyn
| Neighborhood | Number of listings | Listings with reviews |
|---|---|---|
| Williamsburg | 1,694 | 1,141 |
| Bedford-Stuyvesant | 1,024 | 713 |
| Bushwick | 588 | 335 |
| Crown Heights | 491 | 304 |
| Greenpoint | 443 | 304 |
| Park Slope | 390 | 258 |
| Clinton Hill | 343 | 234 |
| Fort Greene | 215 | 155 |
| Flatbush | 231 | 140 |
| Prospect Heights | 183 | 127 |
| Lefferts Garden | 167 | 106 |
| Boerum Hill | 138 | 97 |
| Carroll Gardens | 127 | 80 |
| Brooklyn Heights | 102 | 74 |
| Gowanus | 83 | 59 |
| Downtown Brooklyn | 82 | 54 |
| Kensington | 64 | 37 |
| DUMBO | 46 | 32 |
| Windsor Terrace | 59 | 31 |
| Red Hook | 33 | 26 |
| Cobble Hill | 30 | 23 |
Source: Skift/Connotate
Manhattan
| Neighborhood | Number of listings | Listings with reviews |
|---|---|---|
| Upper West Side | 1,276 | 853 |
| Harlem | 978 | 741 |
| Hell’s Kitchen | 1,119 | 713 |
| Upper East Side | 1,091 | 668 |
| Lower East Side | 726 | 524 |
| West Village | 730 | 494 |
| Chelsea | 699 | 482 |
| East Village | 659 | 474 |
| Midtown | 570 | 414 |
| Alphabet City | 447 | 355 |
| East Harlem | 374 | 251 |
| Greenwich Village | 349 | 235 |
| Washington Heights | 392 | 214 |
| Kips Bay | 419 | 219 |
| Soho | 229 | 166 |
| Financial District | 353 | 166 |
| Chinatown | 234 | 165 |
| Flatiron District | 254 | 147 |
| Gramercy Park | 228 | 140 |
| Midtown East | 347 | 136 |
| Nolita | 179 | 113 |
| Tribeca | 171 | 83 |
| Times Square/Theatre District | 72 | 46 |
| Noho | 60 | 46 |
| Inwood | 61 | 43 |
| Battery Park City | 100 | 40 |
| Morningside Heights | 93 | 33 |
| Hudson Square | 37 | 26 |
| Meatpacking District | 33 | 23 |
| Civic Center | 25 | 14 |
| Murray Hill | 5 | 2 |
| Little Italy | 3 | 1 |
| Union Square | 2 | 0 |
Source: Skift/Connotate
A Note About Numbers
Airbnb’s main New York City page says it has over 34,000 listings spread between 60 neighborhoods. This is different than our total of under 20,000 listings. It appears that this discrepancy is due to Airbnb counting listings twice that are in overlapping neighborhoods. For instance, on the site all locations in the South Street Seaport area are also listed in the Financial District. Our neighborhood count listing numbers are lower for some neighborhoods, like Times Square that overlap with larger neighborhoods, like Midtown.
Dwell Newsletter
Get breaking news, analysis and data from the week’s most important stories about short-term rentals, vacation rentals, housing, and real estate.
Have a confidential tip for Skift? Get in touch
Photo credit: Manhattan has the lion's share of New York City's Airbnb listings. Skift