Skift Take
What kind of innovation could break this cycle of fuller planes and longer flights? Could technology and design changes play a big role any time soon in this? Looks unlikely because of capital required and the lack of political will to make radical changes.
Anecdotally — as in our own in-real-life experience — we know how terrible the air flying experience is these days, especially Stateside, and how it has deteriorated over the years. Now new data from FAA released as part of its Annual Aerospace Forecast Fiscal Years 2012-2033 confirms it with data, both historical and future.
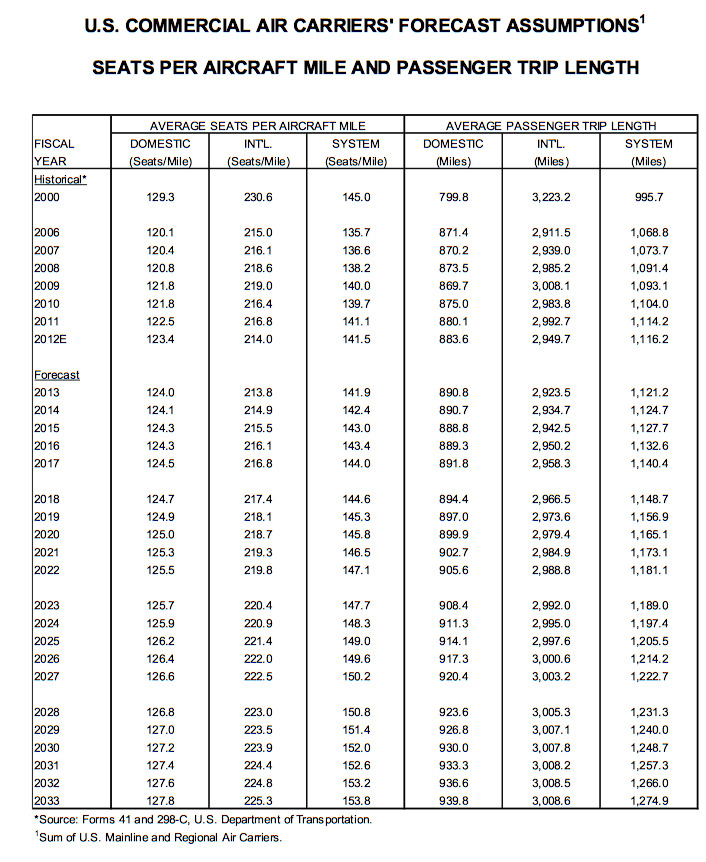
From the FAA forecast, both average trip length and average seats per aircraft mile — measure of how many seats fit into an aircraft — have been increasing steadily since 2000 for U.S. commercial air carriers. Both are forecast to continue going in an upwards trajectory for years to come.
In 2012 the average U.S. domestic passenger trip length increased by 3.5 miles to 883.6 miles in total, after increasing by 5.1 miles in 2011. Passenger trip length is forecast to increase by 7.2 miles in 2013 as carriers continue to reduce capacity and move away from smaller markets. After 2013, trip length is projected to remain stable for a number of years before steadily increasing from 2018 onwards, reaching 939.8 miles by 2033.
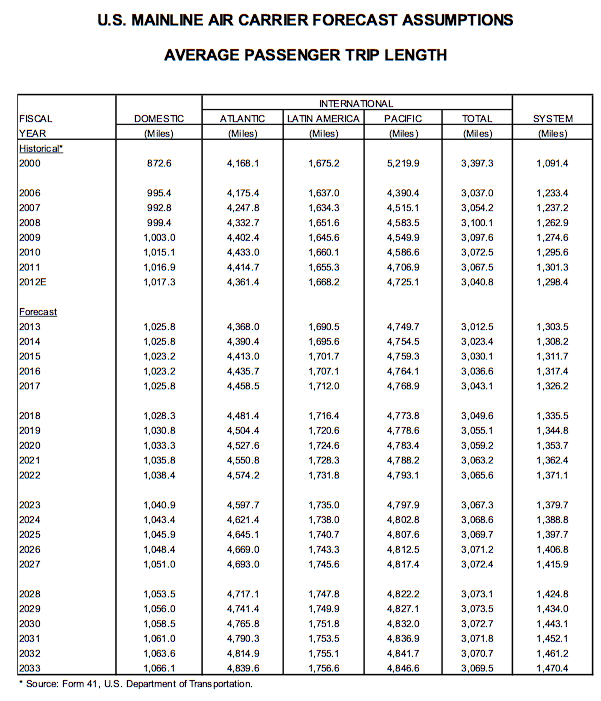
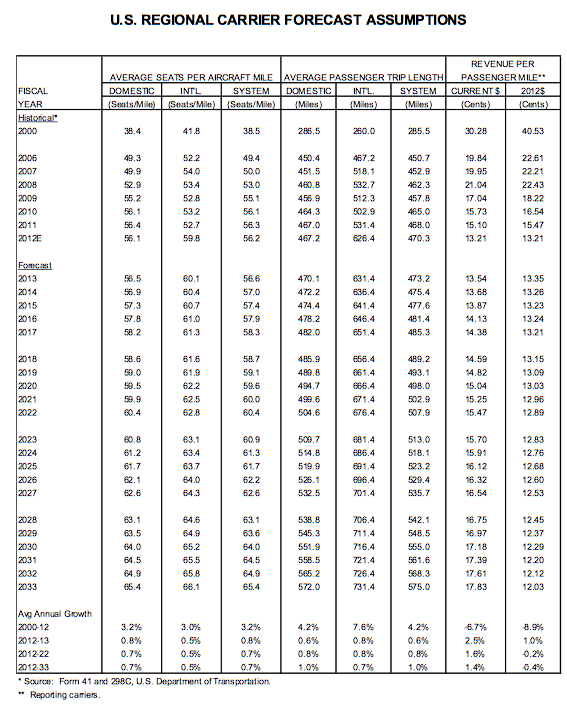
Reflects longer trips flown by the mainline and regional carrier group. Mainline carrier trip length increases as thinner, relatively shorter haul markets are relinquished to regional partners and replaced with longer domestic trips. Regional carrier trip length increases as flying in shorter haul markets is abandoned and/or reduced as more of the larger 70 and 90-seat regional jets continue to penetrate thinner longer-haul markets previously served with mainline equipment.
In other words, consolidation of mainstream airlines in U.S. married with their pullback from unprofitable routes and reliance on more and more on regional carriers to pick up the slack has led to where we are now, and will continue in the foreseeable future.
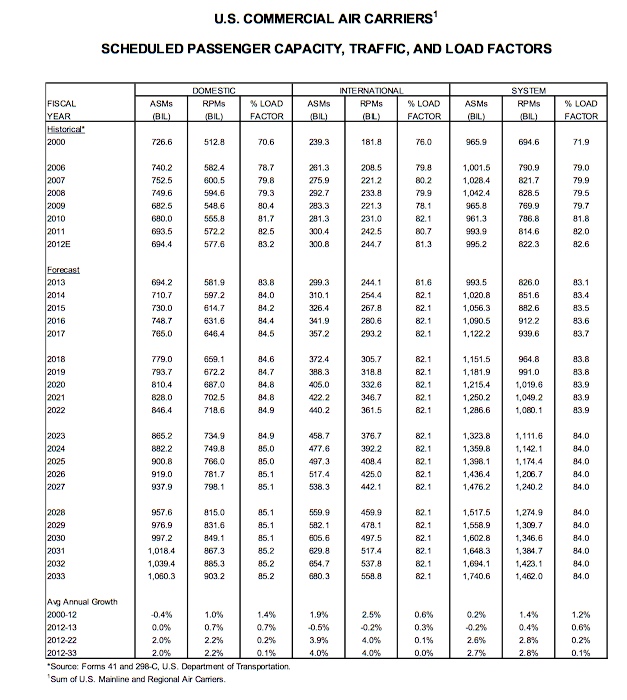
Add to that, the average load factors on airlines — measure of how full an aircraft flight is these days — reached a record-breaking 82.6 points, up 0.7 points from 2011 (this is blended domestic plus international data). The load factors are so high, it doesn’t have much more room to grow without bigger planes, and is projected to grow moderately during the early years of the forecast period then tapering during the mid to latter years to 83.9 percent in 2033.
For domestic airlines, the load factor increased 0.7 points during FY 2012 to an all-time high of 83.2 percent: mainline carrier group posted a load factor of 84.1 percent, up 0.5 percentage points from 2011, while regional carriers increased by 1.4 points to 77.6 percent.
In 2013, the domestic load factor is forecast to increase 0.6 points to 83.2 percent as both mainline and regional carriers increase by 0.6 percentage points. From there, the commercial carrier domestic load factor gradually rises to 85.2 percent by 2033.
The charts below from the FAA forecast present detailed data on average trip length, average seats per mile, average load factors, broken down by domestic and international flights, and by mainline and regional carriers.
Chart 1: Trip length and average seat miles, mix of mainline & regional carriers:
Chart 2: Mainline carriers and increase in trip lengths, mostly coast to coast
Chart 3: Regional carries and trip lengths + seats per mile
Chart 4: Load factors for domestic and international flights
The Daily Newsletter
Our daily coverage of the global travel industry. Written by editors and analysts from across Skift’s brands.
Have a confidential tip for Skift? Get in touch
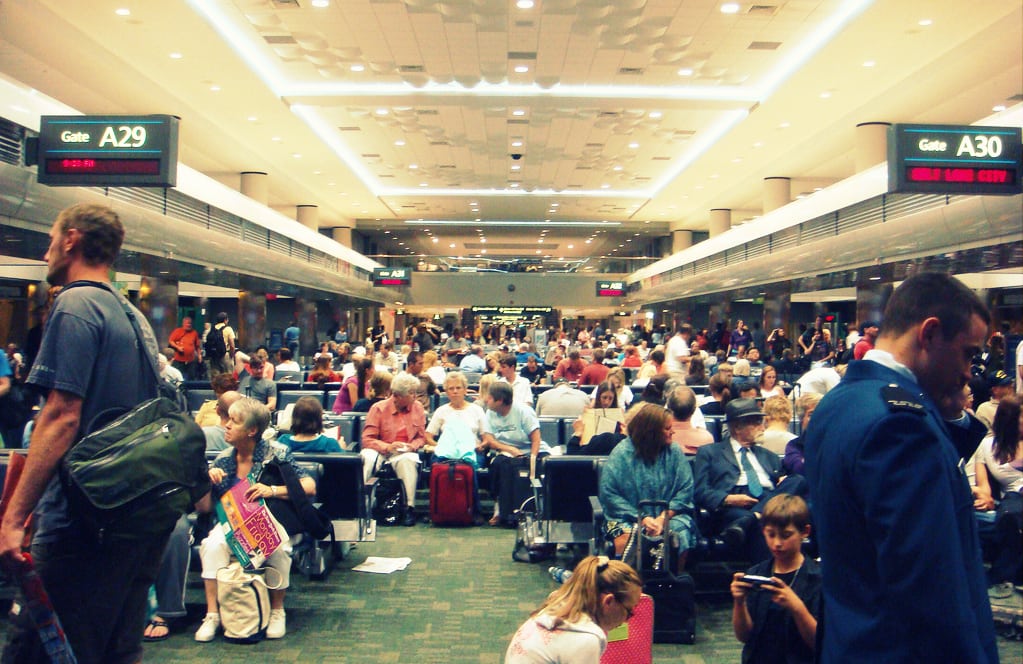
Photo credit: Crowded, longer flights is the trend of the now, and the future, says FAA. Nick Sherman / Flickr.com
